What REALLY terrifies climate scientists: "Feedback"

Notice it is not straight line, but rather curves upward. For those who did not take calculus, this means the increase of CO2 is accelerating.

Keeling_Curve_full_record.png

In quadratic form --- the 2nd order term (acceleration) is pretty insignificant.

I give you an F in calculus. In fact, this statement by you is a reveal that you clearly have zero idea what you are talking about. You are a charlatan, which is a safe bet when it comes to any and all deniers.

Keep reading moron. And TRY to get your foot out of your mouth. A couple posts down, OldyRocks posts a "fact sheet" from NASA PR team on "Space Math" (lol) that completely validates my assertion.

Cut it out -- you're getting annoying.. I still want the discussion..
 
Notice it is not straight line, but rather curves upward. For those who did not take calculus, this means the increase of CO2 is accelerating.

Keeling_Curve_full_record.png

In quadratic form --- the 2nd order term (acceleration) is pretty insignificant.

I give you an F in calculus. In fact, this statement by you is a reveal that you clearly have zero idea what you are talking about. You are a charlatan, which is a safe bet when it comes to any and all deniers.

I give you an F in Science and Calculus. You don't dick swing your way thru either of these. It's never a brawl. Never seen contact martial arts in ANY of those academic endeavors.
 
The air temp and ocean temps are increasing every year. You can accuse the weather stations of being in selectively "hot" locations, but that wouldn't cause the glaciers to be melting and the sea levels to be rising. It is getting warmer. So okay, flip your argument if you can't refute that the glaciers are melting and the sea levels are rising. Then say okay, warming is natural cycle. We didn't cause it and we can't stop it.
Except we know C02 has been added to the atmosphere from industrialization over the past 150 years. We know C02 contributes to warmer temps. We also know from studying millions of years of climate change records that it has never gone through a warming cycle so quickly before?

You all say, there's nothing we can do to change it.

Okay. But don't stand behind stupid shit like saying the weather stations are being put in "hot" areas and it's not really getting warmer.

Nobody's saying it's not warming. Many of us are saying "the herd's been panicked by early scientific blurt-outs that were WAY too frightening". It's getting warmer every year by about 0.013DegC. That's 0.13degC/decade or 1.3DegC/century. THAT'S the reliable more homogeneous Satellite record over about 35 years. At THAT RATE -- it's no where NEAR the crisis it was initially portrayed as.

The point is --- the public is still reading prognostications from the 80s of apocalyptic doom, and the science has been revised WAY DOWN since then. Which some of us "skeptics" believed from the beginning. Because all the catastrophic aspects of GW theory like runaway accelerations, net positive feedbacks, non-returnable "trigger temps" -- were NEVER "settled science". And the public debate and argument in the media was sheer crap and a disservice to science.
 
The air temp and ocean temps are increasing every year. You can accuse the weather stations of being in selectively "hot" locations, but that wouldn't cause the glaciers to be melting and the sea levels to be rising. It is getting warmer. So okay, flip your argument if you can't refute that the glaciers are melting and the sea levels are rising. Then say okay, warming is natural cycle. We didn't cause it and we can't stop it.
Except we know C02 has been added to the atmosphere from industrialization over the past 150 years. We know C02 contributes to warmer temps. We also know from studying millions of years of climate change records that it has never gone through a warming cycle so quickly before?

You all say, there's nothing we can do to change it.

Okay. But don't stand behind stupid shit like saying the weather stations are being put in "hot" areas and it's not really getting warmer.


I was just in the Philippines this summer. My wife and I went back to a resort we stayed at 10 years ago. The water level had not changed AT ALL. The same places we took pictures in had exactly the same water levels they had when we took pictures of them 10 years ago.

In order to believe the liberal story of rising oceans I would have to deny seeing what I have seen.


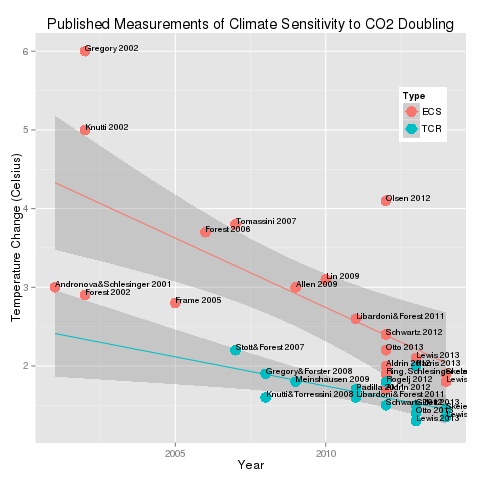
Fort Fun Indiana Here's a version of the Climate Sensitivity "magic multiplier" over the years. You can see how they have been progressively whittled down. THis is NOT the version I was looking for. Maybe IanC will see this "bat signal" and help me out with a more comprehensive chart that I know he has.

climate_sensitivity5.png


All those initially WRONG, frighteningly HIGH climate models used these MUCH HIGHER number to fuck up their prognostications. Because the CSens. number(s) are some of the most important modeling inputs.

In addition, you'll find ample sources to show my comments about the "NON FEEDBACK -- NO MAGIC" atmos physics is generally accepted by warmers and skeptics alike. Even the IPCC has referred to it numerous times.

CO2 no-feedback sensitivity

Hence, the CO2 no feedback sensitivity can only be calculated using models. Determination of the no feedback sensitivity has two parts:

¦calculation of the direct radiative forcing associated with doubling CO2
¦determination of the equilibrium change of global mean surface temperature in response to the CO2 forcing
The IPCC TAR adopted the value of 3.7 W/m2 for the direct CO2 forcing, and I could not find an updated value from the AR4. This forcing translates into 1C of surface temperature change. These numbers do not seem to be disputed, even by most skeptics. Well, perhaps they should be disputed.

So once we calculate the direct no feedback CO2 forcing (to a doubling of CO2, it is often stated that all scientists agree that the Earth’s temperature would respond by increasing 1C.
 
The air temp and ocean temps are increasing every year. You can accuse the weather stations of being in selectively "hot" locations, but that wouldn't cause the glaciers to be melting and the sea levels to be rising. It is getting warmer. So okay, flip your argument if you can't refute that the glaciers are melting and the sea levels are rising. Then say okay, warming is natural cycle. We didn't cause it and we can't stop it.
Except we know C02 has been added to the atmosphere from industrialization over the past 150 years. We know C02 contributes to warmer temps. We also know from studying millions of years of climate change records that it has never gone through a warming cycle so quickly before?

You all say, there's nothing we can do to change it.

Okay. But don't stand behind stupid shit like saying the weather stations are being put in "hot" areas and it's not really getting warmer.


I was just in the Philippines this summer. My wife and I went back to a resort we stayed at 10 years ago. The water level had not changed AT ALL. The same places we took pictures in had exactly the same water levels they had when we took pictures of them 10 years ago.

In order to believe the liberal story of rising oceans I would have to deny seeing what I have seen.


Just saying.. Over 10 years at the rate SL is rising -- you'd have to recognize something just over an inch..

:banana: But hey.. You're putting minds at ease.. :biggrin:
 
Just saying.. Over 10 years at the rate SL is rising -- you'd have to recognize something just over an inch..

:banana: But hey.. You're putting minds at ease.. :biggrin:

Old Lady being excluded of course, there are no "minds" of any relevance in the MMGW cult. They're no more intellectually curious than parrots.

You would think someone could go to a place like Boston Harbor and point to a difference in water level, or Venice for that matter. The problem there isn't rising water, it's sinking buildings.
 
The air temp and ocean temps are increasing every year. You can accuse the weather stations of being in selectively "hot" locations, but that wouldn't cause the glaciers to be melting and the sea levels to be rising. It is getting warmer. So okay, flip your argument if you can't refute that the glaciers are melting and the sea levels are rising. Then say okay, warming is natural cycle. We didn't cause it and we can't stop it.
Except we know C02 has been added to the atmosphere from industrialization over the past 150 years. We know C02 contributes to warmer temps. We also know from studying millions of years of climate change records that it has never gone through a warming cycle so quickly before?

You all say, there's nothing we can do to change it.

Okay. But don't stand behind stupid shit like saying the weather stations are being put in "hot" areas and it's not really getting warmer.


I was just in the Philippines this summer. My wife and I went back to a resort we stayed at 10 years ago. The water level had not changed AT ALL. The same places we took pictures in had exactly the same water levels they had when we took pictures of them 10 years ago.

In order to believe the liberal story of rising oceans I would have to deny seeing what I have seen.

I don't what to tell you Pete. Ask the folks in Norfolk. The tide keeps entering the streets, without a storm.
 
Just saying.. Over 10 years at the rate SL is rising -- you'd have to recognize something just over an inch..

:banana: But hey.. You're putting minds at ease.. :biggrin:

Old Lady being excluded of course, there are no "minds" of any relevance in the MMGW cult. They're no more intellectually curious than parrots.

You would think someone could go to a place like Boston Harbor and point to a difference in water level, or Venice for that matter. The problem there isn't rising water, it's sinking buildings.
Boston is sinking? I knew about Venice.
 
Boston is sinking? I knew about Venice.

I've addressed that. I have heard not a peep about Boston Harbor struggling with rising sea levels, or the Netherlands, or New Orleans, or any other place. I can only believe what I have seen with my own eyes at this point, and the rock islands in the Philippines that we climbed around on have areas worn out by thousands of years of waves crashing in on them and they have shown no sign of rising water.

Sorry, but when I hear people talk about rising oceans I don't believe them because I have seen evidence they are wrong.


Notice it is not straight line, but rather curves upward. For those who did not take calculus, this means the increase of CO2 is accelerating.

Keeling_Curve_full_record.png

In quadratic form --- the 2nd order term (acceleration) is pretty insignificant.
Interesting. So, let is do the math. From just before 2010.

https://spacemath.gsfc.nasa.gov/earth/6Page54.pdf

Problem 1 - Answer: The general shape of the curve suggests a polynomial function of loworder, whose amplitude is modulated by the addition of a sinusoid. The two simplest functions that satisfy this constraint are a 'quadratic' and a 'cubic'… where 't' is the elapsed time in years since 1982
..................................................................................................................................................................
Problem 3 - What would you predict as the carbon dioxide concentration (ppm), and mass for the years:

A) 2020? B)2050, C)2100? Answer: A) t = 2020-1982 = 38, so Fco2(38) = 7.83 x 410 ppm = 3,200 gigatons

B) t = 2050-1982 = 68, so Fco2(68) = 7.83 x 502 ppm = 3,900 gigatons

C) t = 2100-1982 = 118, so Fco2(118) = 7.83 x 718 ppm = 5,600 gigatons

So they did the math about 2010, and came up with 410 ppm by 2020. Except we now have 410 ppm, and 2017 is not done yet. How much are they off on the other two figures? Perhaps that should be revisited and other curves tried, and see what matches best the present reality.

Ooooh.. You're turning me on here. :banana: Thank you for finding that NASA "space math" just validated my assertion that the ACCELERATION is negligible.

Problem 1 - Answer: The general shape of the curve suggests a polynomial function of loworder, whose amplitude is modulated by the addition of a sinusoid. The two simplest functions that satisfy this constraint are a 'quadratic' and a 'cubic'… where 't' is the elapsed time in years since 1982 F1 = A sin (Bt + C) + (Dt2 + Et + F) and F2 = A sin(Bt + C) + (Dt3 + Et2 + Ft + G) We have to solve for the two sets of constants A, B, C, D , E, F and for A, B, C, D, E, F, G. Using Excel and some iterations, as an example, the constants that produce the best fits appear to be: F1: (3.5, 6.24, -0.5, +0.0158, +1.27, 342.0) and F2: (3.5, 6.24, -0.5, +0.0012, - 0.031, +1.75, +341.0). Hint: Compute the yearly averages and fit these, then subtract this polynomial from the actual data and fit what is left over (the residual) with a sin function.)


Forget F2 -- it's overkill but gives the same "minimal acceleration answer.. And forget the sinusoidal term which is the annual variation that doesn't change into future insight. So for F1

D is the acceleration with time = 0.0158
E is the LINEAR term with time = 1.27
F is the offset = 342

Any acceleration Fort Fun is seeing in that graph -- is insignificant error to a simple linear fit..

And you're whining about CO2 projections being off by THREE years? Why??
LOL Damn, I cannot believe that you said that. In other words, you are depending on the fact that most people will not read this critically in order to mislead. The math was done in 2010, the prediction for 2020, 10 years from that time, was achieved by 2017. That is 30% of the time in the prediction. Run that on out, and there is going to be a very large difference between the predicted 502 ppm and what there actually is at that time. Out to 2100, the difference will be huge.

And, in the meantime, we get to deal with the effects that you deniers wished upon us, even though we could already be preventing some of the worse effects.
 
Notice it is not straight line, but rather curves upward. For those who did not take calculus, this means the increase of CO2 is accelerating.

Keeling_Curve_full_record.png

In quadratic form --- the 2nd order term (acceleration) is pretty insignificant.

I give you an F in calculus. In fact, this statement by you is a reveal that you clearly have zero idea what you are talking about. You are a charlatan, which is a safe bet when it comes to any and all deniers.

Keep reading moron. And TRY to get your foot out of your mouth. A couple posts down, OldyRocks posts a "fact sheet" from NASA PR team on "Space Math" (lol) that completely validates my assertion.

Cut it out -- you're getting annoying.. I still want the discussion..
On the contrary, it invalidated your math. What was predicted for 10 years, occurred in 7. That is a huge difference in a mathematical curve. If the curve were linear, you could say that what was predicted for 2050 would have occurred about 2036. But it is not linear, so it will have occurred much sooner than that.
 
Notice it is not straight line, but rather curves upward. For those who did not take calculus, this means the increase of CO2 is accelerating.

Keeling_Curve_full_record.png

In quadratic form --- the 2nd order term (acceleration) is pretty insignificant.

I give you an F in calculus. In fact, this statement by you is a reveal that you clearly have zero idea what you are talking about. You are a charlatan, which is a safe bet when it comes to any and all deniers.

Keep reading moron. And TRY to get your foot out of your mouth. A couple posts down, OldyRocks posts a "fact sheet" from NASA PR team on "Space Math" (lol) that completely validates my assertion.

Cut it out -- you're getting annoying.. I still want the discussion..
On the contrary, it invalidated your math. What was predicted for 10 years, occurred in 7. That is a huge difference in a mathematical curve. If the curve were linear, you could say that what was predicted for 2050 would have occurred about 2036. But it is not linear, so it will have occurred much sooner than that.
 
Notice it is not straight line, but rather curves upward. For those who did not take calculus, this means the increase of CO2 is accelerating.

Keeling_Curve_full_record.png

In quadratic form --- the 2nd order term (acceleration) is pretty insignificant.
Interesting. So, let is do the math. From just before 2010.

https://spacemath.gsfc.nasa.gov/earth/6Page54.pdf

Problem 1 - Answer: The general shape of the curve suggests a polynomial function of loworder, whose amplitude is modulated by the addition of a sinusoid. The two simplest functions that satisfy this constraint are a 'quadratic' and a 'cubic'… where 't' is the elapsed time in years since 1982
..................................................................................................................................................................
Problem 3 - What would you predict as the carbon dioxide concentration (ppm), and mass for the years:

A) 2020? B)2050, C)2100? Answer: A) t = 2020-1982 = 38, so Fco2(38) = 7.83 x 410 ppm = 3,200 gigatons

B) t = 2050-1982 = 68, so Fco2(68) = 7.83 x 502 ppm = 3,900 gigatons

C) t = 2100-1982 = 118, so Fco2(118) = 7.83 x 718 ppm = 5,600 gigatons

So they did the math about 2010, and came up with 410 ppm by 2020. Except we now have 410 ppm, and 2017 is not done yet. How much are they off on the other two figures? Perhaps that should be revisited and other curves tried, and see what matches best the present reality.

Ooooh.. You're turning me on here. :banana: Thank you for finding that NASA "space math" just validated my assertion that the ACCELERATION is negligible.

Problem 1 - Answer: The general shape of the curve suggests a polynomial function of loworder, whose amplitude is modulated by the addition of a sinusoid. The two simplest functions that satisfy this constraint are a 'quadratic' and a 'cubic'… where 't' is the elapsed time in years since 1982 F1 = A sin (Bt + C) + (Dt2 + Et + F) and F2 = A sin(Bt + C) + (Dt3 + Et2 + Ft + G) We have to solve for the two sets of constants A, B, C, D , E, F and for A, B, C, D, E, F, G. Using Excel and some iterations, as an example, the constants that produce the best fits appear to be: F1: (3.5, 6.24, -0.5, +0.0158, +1.27, 342.0) and F2: (3.5, 6.24, -0.5, +0.0012, - 0.031, +1.75, +341.0). Hint: Compute the yearly averages and fit these, then subtract this polynomial from the actual data and fit what is left over (the residual) with a sin function.)


Forget F2 -- it's overkill but gives the same "minimal acceleration answer.. And forget the sinusoidal term which is the annual variation that doesn't change into future insight. So for F1

D is the acceleration with time = 0.0158
E is the LINEAR term with time = 1.27
F is the offset = 342

Any acceleration Fort Fun is seeing in that graph -- is insignificant error to a simple linear fit..

And you're whining about CO2 projections being off by THREE years? Why??
LOL Damn, I cannot believe that you said that. In other words, you are depending on the fact that most people will not read this critically in order to mislead. The math was done in 2010, the prediction for 2020, 10 years from that time, was achieved by 2017. That is 30% of the time in the prediction. Run that on out, and there is going to be a very large difference between the predicted 502 ppm and what there actually is at that time. Out to 2100, the difference will be huge.

And, in the meantime, we get to deal with the effects that you deniers wished upon us, even though we could already be preventing some of the worse effects.

I really didn't pay much attention to that Problem number. I was only focused on the fact you handed me the quadratic fit to Fort Fun's chart. If ya want -- I'll go back and figure out what went wrong. Because a LINEAR fit to a 10 year span of CO2 conc -- should work TOTALLY fine -- 10 years out..

MY GUESS IS -- you are taking the CURRENT MONTHLY CO2 number which is approaching a YEARLY Peak in it's cycle. And because the sinusoid that is the yearly peak rides this curve repeatedly, you get an amplitude that is THREE YEARS worth of "seasonally too high". Check it out. Amplitude of the yearly cycle is equivalent to 3 or 5 years of linear accumulation...
 
Climate scientists have confidence in a few things, for instance: the minimum amount of warming the climate will experience in the next 100 years, the primary driver of the observed, rapid warming, and the fact that the oceans are acidifying.

But, what terrifies scientists is not "the known", but rather, "the unknown". Scientists are worried that there exist certain thresholds, past which there will be runaway effects. This is related to the idea of "feedback loops". For instance, as more land and sea ice disappears, the climate will warm more quickly, causing even faster disappearance of land and sea ice... and so on.

Now that scientists have had more time to study our warming climate, they are starting to find these feedback loops in action. They are discovering, slowly but surely, that "albedo feedback" is causing an acceleration in the loss of arctic sea ice: https://www.sciencedaily.com/releases/2017/09/170906103622.htm

Now, scientists have always postulated this would be the case, but they have needed time to build the evidence that this is true. They now have it.

There are other feedback loops to consider, such as melting tundra and ocean acidification. While the major economies of the world dither to preserve short-term growth, the scientists of the world are banging pots and pans and sounding the sirens that, by the time they can convince even the most scientifically illiterate person of the dangers of inaction on climate change, it will be too late.
And yet every prediction your cult has made has failed...

Arctic ice.. still there...

Rising seas... Nope

Rising temps... Nope

Models.... can predict anything... OOP's
cmip5-73-models-vs-obs-20n-20s-mt-5-yr-means11 Dr Roy Spencer.png
 
Or the geniuses that crafted this HSchool math page of "Space Math" didn't sync up the PHASE of the sinewave included in the fit to model the annual variation to actual calendar seasons..
 
Or the geniuses that crafted this HSchool math page of "Space Math" didn't sync up the PHASE of the sinewave included in the fit to model the annual variation to actual calendar seasons..
If you place many of the cycles on a graph, the times the earth has major changes is generally when these cycles all go high or low at the same time..

WE know so little its funny as hell to watch these people make predictions and then look confused when their predictions fail. Is it due to arrogance or ignorance?
 

Forum List

Back
Top