Billy_Bob
Diamond Member
Solar Activity Flatlines: Weakest solar cycle in 200 years
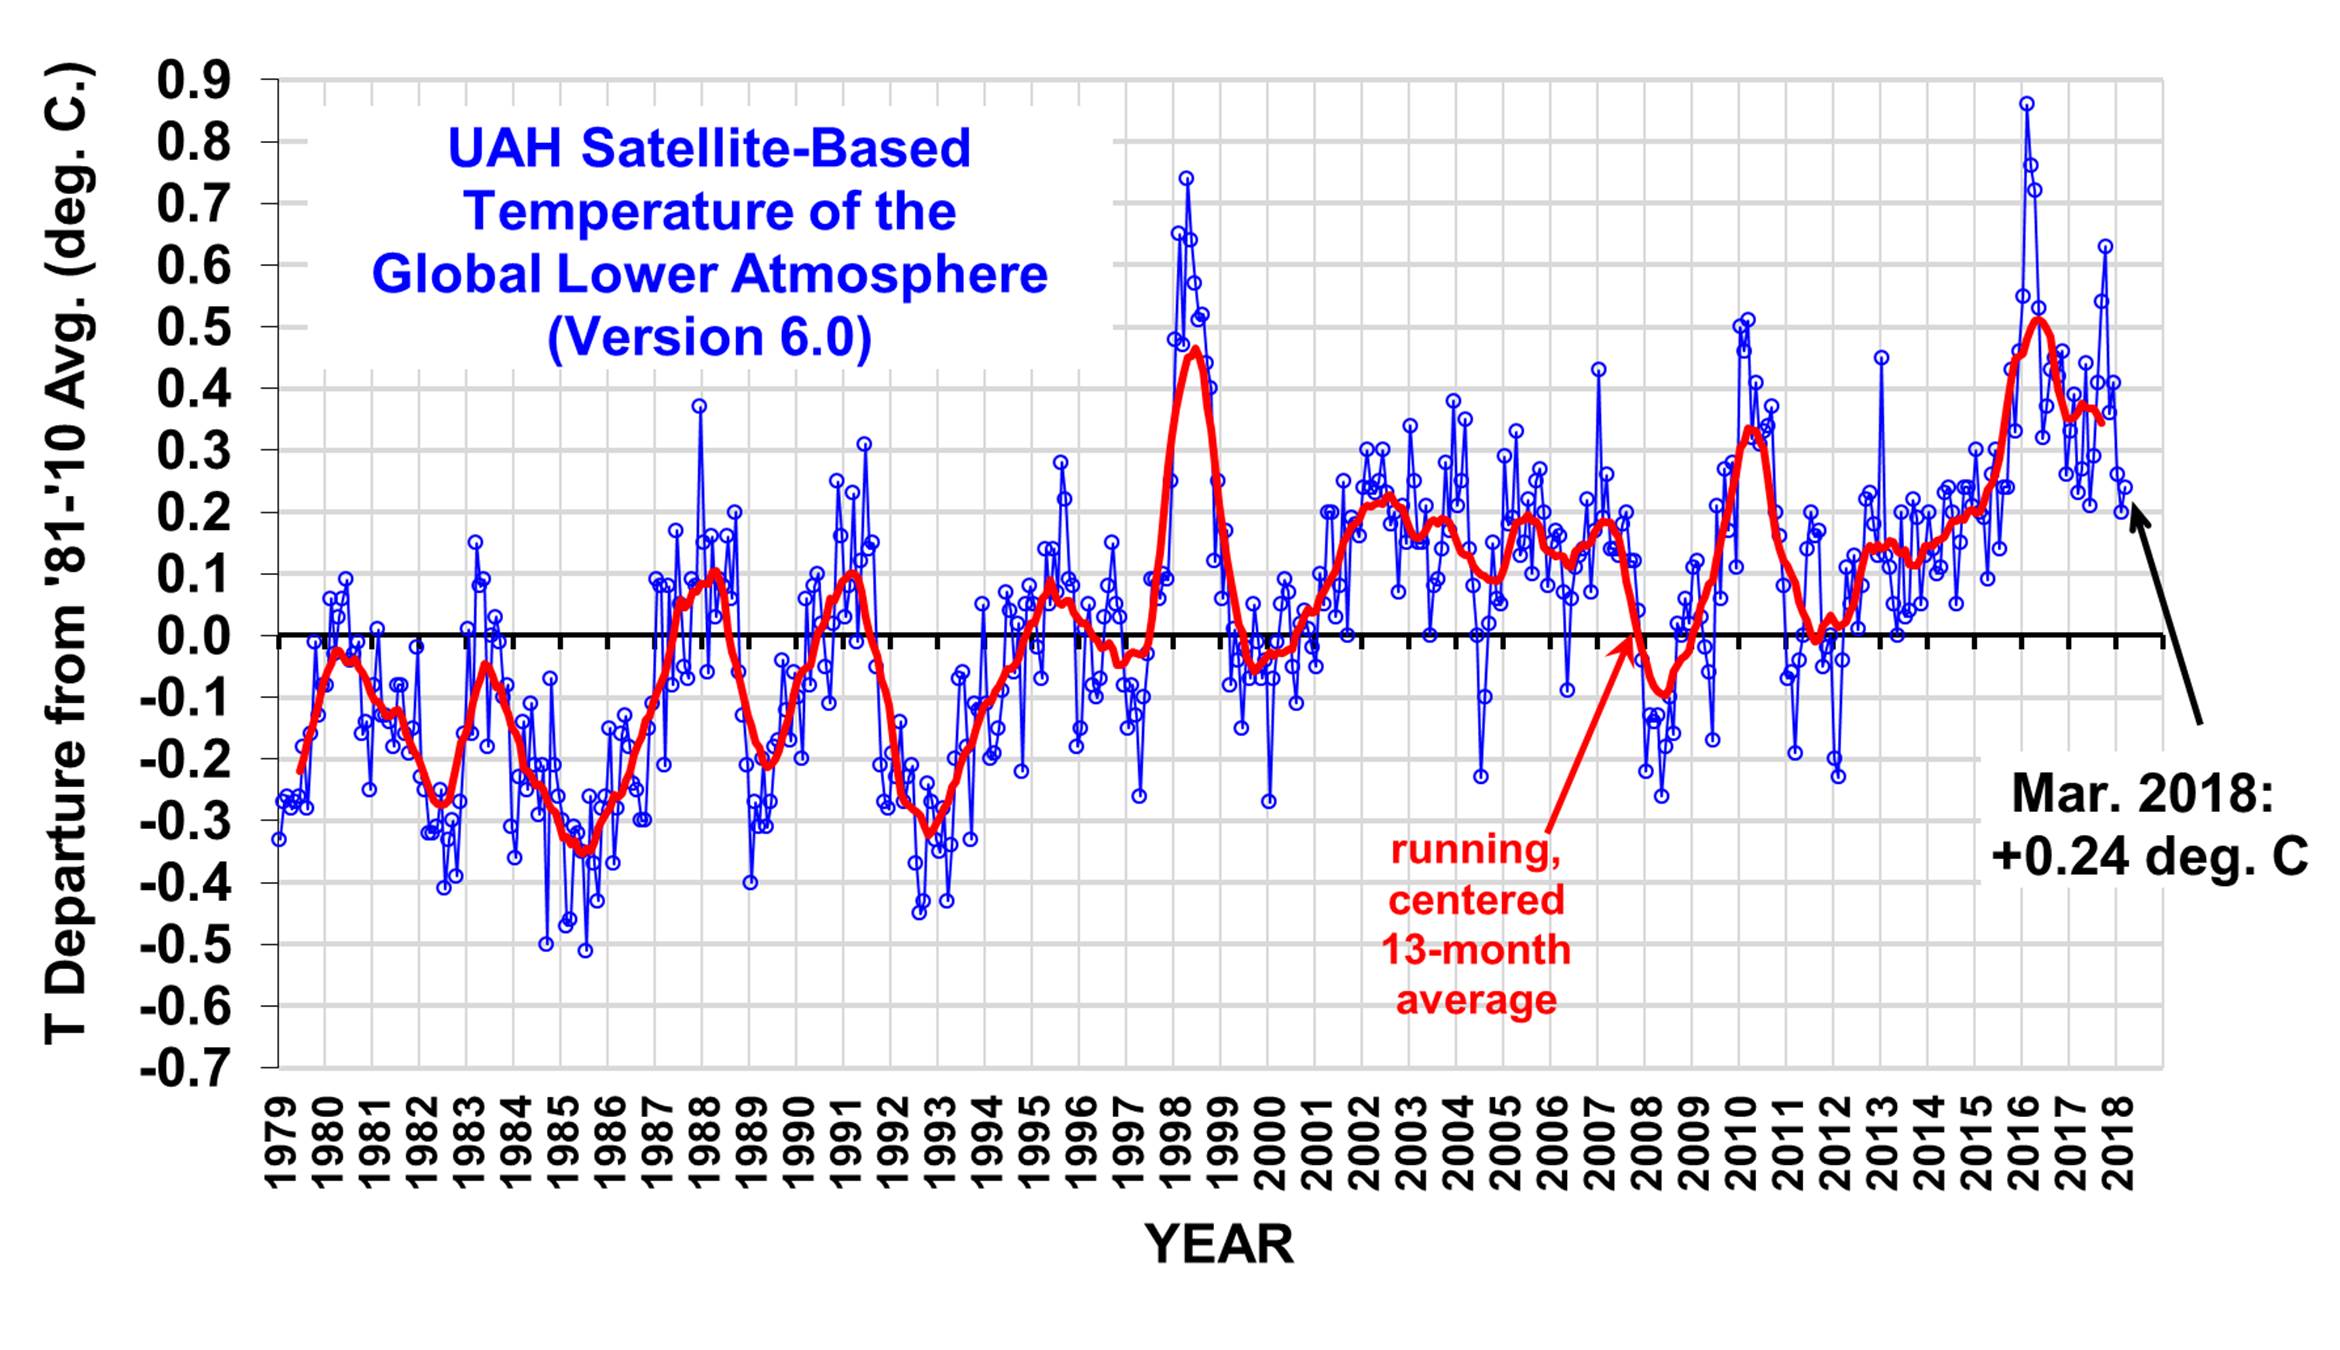
Well the convergence of cooling factors has hit and as NASA reported we have had a -0.56Dec C drop in just two years.. That is over half of the 0.82 deg C of warming that has occurred in the last 170 years.
The ENSO is again going cold and hopes for a warm ocean surface are again fading for the next few years.
And now the SUN is entering Solar Minimum where low solar output will rule for 3-5 years.
External indicators are for continued cooling to continue...

The last time the sun was this calm was solar cycle 5 right before entering the Little Ice Age and Dalton events.....
Well the convergence of cooling factors has hit and as NASA reported we have had a -0.56Dec C drop in just two years.. That is over half of the 0.82 deg C of warming that has occurred in the last 170 years.
The ENSO is again going cold and hopes for a warm ocean surface are again fading for the next few years.
And now the SUN is entering Solar Minimum where low solar output will rule for 3-5 years.
External indicators are for continued cooling to continue...
The last time the sun was this calm was solar cycle 5 right before entering the Little Ice Age and Dalton events.....
Last edited: