Navigation
Install the app
How to install the app on iOS
Follow along with the video below to see how to install our site as a web app on your home screen.

Note: This feature currently requires accessing the site using the built-in Safari browser.
More options
You are using an out of date browser. It may not display this or other websites correctly.
You should upgrade or use an alternative browser.
You should upgrade or use an alternative browser.
Weakest solar cycle in 200 years
- Thread starter Billy_Bob
- Start date
Sunsettommy
Diamond Member
- Mar 19, 2018
- 14,894
- 12,528
- 2,400
Again you use the worse temperature data set, which has been repeatedly adjusted to cool the past and warm the present, which invalidates your claim, besides you keep IGNORING the well documented Per Decade warming rate failure as predicted/projected by the IPCC.
Crepitus
Diamond Member
- Mar 28, 2018
- 72,152
- 60,426
- 3,615
And still 2017 was the third warmest year on record. In fact the hottest on record without an elnino boost.Solar Activity Flatlines: Weakest solar cycle in 200 years
Well the convergence of cooling factors has hit and as NASA reported we have had a -0.56Dec C drop in just two years.. That is over half of the 0.82 deg C of warming that has occurred in the last 170 years.
The ENSO is again going cold and hopes for a warm ocean surface are again fading for the next few years.
And now the SUN is entering Solar Minimum where low solar output will rule for 3-5 years.
External indicators are for continued cooling to continue...

The last time the sun was this calm was solar cycle 5 right before entering the Little Ice Age and Dalton events.....
Sunsettommy
Diamond Member
- Mar 19, 2018
- 14,894
- 12,528
- 2,400
And still 2017 was the third warmest year on record. In fact the hottest on record without an elnino boost.Solar Activity Flatlines: Weakest solar cycle in 200 years
Well the convergence of cooling factors has hit and as NASA reported we have had a -0.56Dec C drop in just two years.. That is over half of the 0.82 deg C of warming that has occurred in the last 170 years.
The ENSO is again going cold and hopes for a warm ocean surface are again fading for the next few years.
And now the SUN is entering Solar Minimum where low solar output will rule for 3-5 years.
External indicators are for continued cooling to continue...
The last time the sun was this calm was solar cycle 5 right before entering the Little Ice Age and Dalton events.....
Still well below the IPCC per decade predicted/projected warming rate.
Go look at Old Rocks post 9 where it shows that it is much cooler now, than two years ago.
Last edited:

- Feb 12, 2007
- 59,384
- 24,018
- 2,290
...as NASA reported we have had a -0.56Dec C drop in just two years...
Let's see a link to that NASA report.
Here you go:
Data.GISS: GISS Surface Temperature Analysis (GISTEMP)
Would it surprise you to learn the greatest global two-year cooling event of the last century just occurred? From February 2016 to February 2018 (the latest month available) global average temperatures dropped 0.56°C. You have to go back to 1982-84 for the next biggest two-year drop, 0.47°C—also during the global warming era. All the data in this essay come from GISTEMP Team, 2018: GISS Surface Temperature Analysis (GISTEMP). NASA Goddard Institute for Space Studies (dataset accessed 2018-04-11 at Data.GISS: GISS Surface Temperature Analysis (GISTEMP)). This is the standard source used in most journalistic reporting of global average temperatures....
https://www.realclearmarkets.com/ar...bal_cooling_event_just_took_place_103243.html
Old Rocks
Diamond Member
As usual you cant read your own chart...Well, here we are, in a La Nina, sun getting colder, and what does the weather do? Just stays warm.

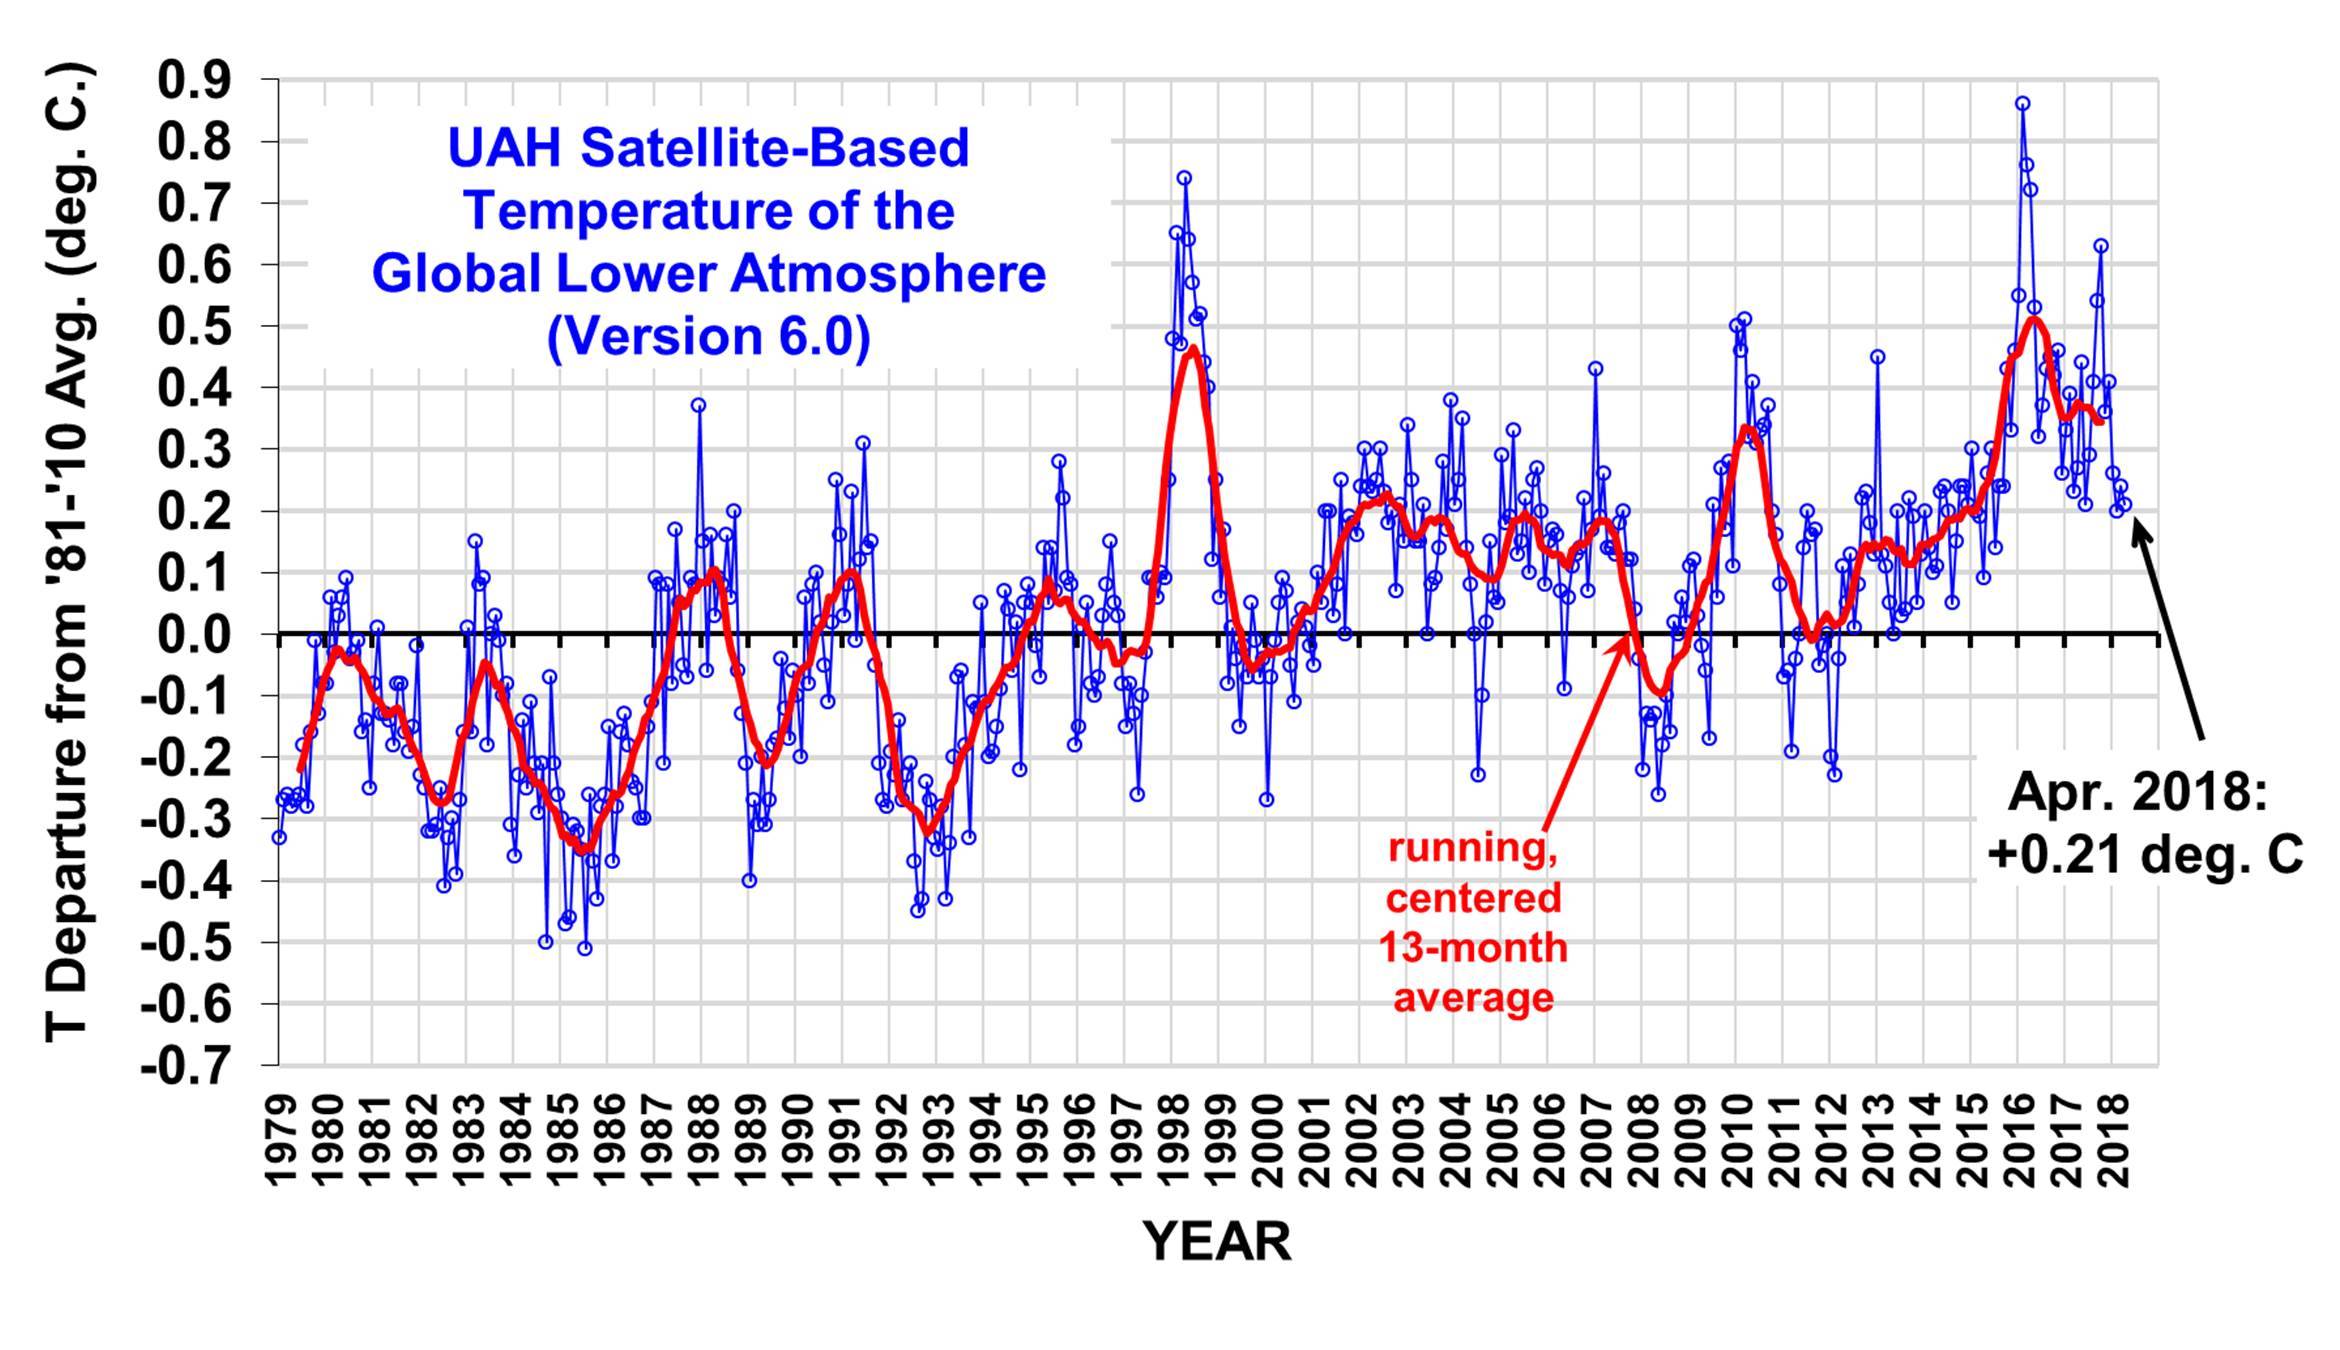
Look at our most recent low, +0.2. That is warmer than all but seven of the years prior to 1997 on satellite record. So, with a cool sun and La Nina, why are we still seeing such warm temperatures?
View attachment 190595
And this months mark is hovering around +0.04 anomaly. Another 2/10th of a degree C drop making the great pause alive an well at 21 years 5 months...
What are you going to do when we go negative on your chart an there is no step increase seen post El Niño and a step decrease is seen?
It's a longer recovery from a huge El Nino.. Not a climate change yet. But we're definitely headed back into the range of "the Pause". Which IS (as GoldieRocks says) significantly above the 1st 20 years of satellite observation. But NO alarming trend (disregarding El Nino events) since 2000 or so..
Ah yes, the 'pause'. LOL So the average between 1979 and 1997 was between -0.1 and -0.2. The 'pause' was between 0.1 and 0.2. And, if this 'pause' continues as it has started, is between 0.3 and 0.4. But, no change, right? LOL
Old Rocks
Diamond Member
A major cooling event? LOL!!!!!!!!!!!!!!!!!!!!!!!!!!!!!!!!!! Just look at all the ice that cooling event has frozen in the Arctic Ocean...as NASA reported we have had a -0.56Dec C drop in just two years...
Let's see a link to that NASA report.
Here you go:
Data.GISS: GISS Surface Temperature Analysis (GISTEMP)
Would it surprise you to learn the greatest global two-year cooling event of the last century just occurred? From February 2016 to February 2018 (the latest month available) global average temperatures dropped 0.56°C. You have to go back to 1982-84 for the next biggest two-year drop, 0.47°C—also during the global warming era. All the data in this essay come from GISTEMP Team, 2018: GISS Surface Temperature Analysis (GISTEMP). NASA Goddard Institute for Space Studies (dataset accessed 2018-04-11 at Data.GISS: GISS Surface Temperature Analysis (GISTEMP)). This is the standard source used in most journalistic reporting of global average temperatures....
https://www.realclearmarkets.com/ar...bal_cooling_event_just_took_place_103243.html
Image 3 of 6 (play slideshow) Download

As usual you cant read your own chart...Well, here we are, in a La Nina, sun getting colder, and what does the weather do? Just stays warm.
Look at our most recent low, +0.2. That is warmer than all but seven of the years prior to 1997 on satellite record. So, with a cool sun and La Nina, why are we still seeing such warm temperatures?
View attachment 190595
And this months mark is hovering around +0.04 anomaly. Another 2/10th of a degree C drop making the great pause alive an well at 21 years 5 months...
What are you going to do when we go negative on your chart an there is no step increase seen post El Niño and a step decrease is seen?
It's a longer recovery from a huge El Nino.. Not a climate change yet. But we're definitely headed back into the range of "the Pause". Which IS (as GoldieRocks says) significantly above the 1st 20 years of satellite observation. But NO alarming trend (disregarding El Nino events) since 2000 or so..
Ah yes, the 'pause'. LOL So the average between 1979 and 1997 was between -0.1 and -0.2. The 'pause' was between 0.1 and 0.2. And, if this 'pause' continues as it has started, is between 0.3 and 0.4. But, no change, right? LOL
That's right. There is no appreciable slope from one El Nino to the next. I'm not gonna sit here and quibble about whether it's 0.05DegC/dec or 0.1DegC/dec. And you don't estimate slopes by pulling the PEAK numbers (like 0.3 or 0.4) out of your ass. There's a regression tool for that. Use it.
At the current slope of the satellite record from both RSS and UAH --- the 100 year warming would be estimated at 1.4DegC. That is DAMN close to the NO feedback, NO Acceleration, CO2 forcing ONLY number.
Where, precisely, do you see a "recovery"?

The NOAA data is now so gafucked that's not even worth commenting on. They need to shut down the data cooking kitchen. Global warming should be measured IN THE ATMOSPHERE --- not in the water storage locker.
Sunsettommy
Diamond Member
- Mar 19, 2018
- 14,894
- 12,528
- 2,400
As usual you cant read your own chart...Well, here we are, in a La Nina, sun getting colder, and what does the weather do? Just stays warm.
Look at our most recent low, +0.2. That is warmer than all but seven of the years prior to 1997 on satellite record. So, with a cool sun and La Nina, why are we still seeing such warm temperatures?
View attachment 190595
And this months mark is hovering around +0.04 anomaly. Another 2/10th of a degree C drop making the great pause alive an well at 21 years 5 months...
What are you going to do when we go negative on your chart an there is no step increase seen post El Niño and a step decrease is seen?
It's a longer recovery from a huge El Nino.. Not a climate change yet. But we're definitely headed back into the range of "the Pause". Which IS (as GoldieRocks says) significantly above the 1st 20 years of satellite observation. But NO alarming trend (disregarding El Nino events) since 2000 or so..
Ah yes, the 'pause'. LOL So the average between 1979 and 1997 was between -0.1 and -0.2. The 'pause' was between 0.1 and 0.2. And, if this 'pause' continues as it has started, is between 0.3 and 0.4. But, no change, right? LOL
You are missing the obvious as usual, since it is the projected warming rate that is a massive failure since the IPCC said it should warm at least .30C per decade. Yet the chart you posted here shows 50% LESS warming rate per decade, which is about the usual rate of warming in ALL warming periods back to the 1800's as Dr. Jones pointed out in the BBC interview
Warmists continue to ignore the NULL Hypothesis on this all the time because they lack the needed critical thinking skill to notice the difference.
Sunsettommy
Diamond Member
- Mar 19, 2018
- 14,894
- 12,528
- 2,400
A major cooling event? LOL!!!!!!!!!!!!!!!!!!!!!!!!!!!!!!!!!! Just look at all the ice that cooling event has frozen in the Arctic Ocean...as NASA reported we have had a -0.56Dec C drop in just two years...
Let's see a link to that NASA report.
Here you go:
Data.GISS: GISS Surface Temperature Analysis (GISTEMP)
Would it surprise you to learn the greatest global two-year cooling event of the last century just occurred? From February 2016 to February 2018 (the latest month available) global average temperatures dropped 0.56°C. You have to go back to 1982-84 for the next biggest two-year drop, 0.47°C—also during the global warming era. All the data in this essay come from GISTEMP Team, 2018: GISS Surface Temperature Analysis (GISTEMP). NASA Goddard Institute for Space Studies (dataset accessed 2018-04-11 at Data.GISS: GISS Surface Temperature Analysis (GISTEMP)). This is the standard source used in most journalistic reporting of global average temperatures....
https://www.realclearmarkets.com/ar...bal_cooling_event_just_took_place_103243.html
Image 3 of 6 (play slideshow) Download
You made a really sad evasion with this baloney since what he posted was based on hard evidence that YOU COMPLETELY avoided answering by making this deflection to something else.
He talks about a data based temperature change from NASA themselves on the GLOBAL temperature drop, which you avoided with this desperate Red Herring about Sea Ice cover.
Got anything better?
As usual you cant read your own chart...Well, here we are, in a La Nina, sun getting colder, and what does the weather do? Just stays warm.
Look at our most recent low, +0.2. That is warmer than all but seven of the years prior to 1997 on satellite record. So, with a cool sun and La Nina, why are we still seeing such warm temperatures?
View attachment 190595
And this months mark is hovering around +0.04 anomaly. Another 2/10th of a degree C drop making the great pause alive an well at 21 years 5 months...
What are you going to do when we go negative on your chart an there is no step increase seen post El Niño and a step decrease is seen?
It's a longer recovery from a huge El Nino.. Not a climate change yet. But we're definitely headed back into the range of "the Pause". Which IS (as GoldieRocks says) significantly above the 1st 20 years of satellite observation. But NO alarming trend (disregarding El Nino events) since 2000 or so..
Ah yes, the 'pause'. LOL So the average between 1979 and 1997 was between -0.1 and -0.2. The 'pause' was between 0.1 and 0.2. And, if this 'pause' continues as it has started, is between 0.3 and 0.4. But, no change, right? LOL
You are missing the obvious as usual, since it is the projected warming rate that is a massive failure since the IPCC said it should warm at least .30C per decade. Yet the chart you posted here shows 50% LESS warming rate per decade, which is about the usual rate of warming in ALL warming periods back to the 1800's as Dr. Jones pointed out in the BBC interview
Warmists continue to ignore the NULL Hypothesis on this all the time because they lack the needed critical thinking skill to notice the difference.
We're still waiting with baited breath (well I'm not) for all those accelerations from all positive feedbacks to kick in and for the planet to reach that "trigger point". Back at the first IPCC report --- we should ALL be craven "warmer zealots" by now. Sorry I've wasted this much of my life following this disappointing mini-series..
But I do have a TINY carbon footprint.. Just for insurance..

I should be begging OldieRocks for forgiveness at LEAST 10 years ago... In the words of Hillary Clinton -- "What HAPPENED?"
.
Sunsettommy
Diamond Member
- Mar 19, 2018
- 14,894
- 12,528
- 2,400
Those much modeled Positive Feedbacks are based on a bogus paradigm, which is why they never existed in the last 600 Million years.
Sunset.........these bozos think the sun has no effect on the climate. 
Old Rocks
Diamond Member
And some assholes are so stupid that they are claiming that the sun is cooling, but that is warming the planet. LOLSunset.........these bozos think the sun has no effect on the climate.
Sunsettommy
Diamond Member
- Mar 19, 2018
- 14,894
- 12,528
- 2,400
What positive feedbacks?
The ones the IPCC talks about since 1990.
sunsettommy said:Those much modeled Positive Feedbacks are based on a bogus paradigm, which is why they never existed in the last 600 Million years.
I ask again, what positive feedbacks do you believe are "based on a bogus paradigm" and haven't existed (functioned?) in the last 600 million years?
1) Temperature/CO2 cycles? See https://agupubs.onlinelibrary.wiley.com/doi/full/10.1029/2005GL025044
2) Loss of permafraost? See Permafrost carbon-climate feedbacks accelerate global warming
3) Increased atmospheric water vapor levels? See https://www.annualreviews.org/doi/abs/10.1146/annurev.energy.25.1.441
4) Albedo loss? See TC - Abstract - Greenland ice sheet albedo feedback: thermodynamics and atmospheric drivers
The work of Marcott and Shakun re temperature reconstructions of the Holocene also clearly observe positive feedback from heat induced CO2 release
So, what is the "bogus paradigm" that you seem to believe links all these feedback mechanisms?
Last edited:
Sunsettommy
Diamond Member
- Mar 19, 2018
- 14,894
- 12,528
- 2,400
1) Models all the way.
2) Models all the way
3) Models all the way, the paper is badly out of date since CO2 doubling sensitivity has dropped radically.
4) Another what if paper that is already sliding out of date since Greenland ice pack loss has dropped a lot to an actual INCREASE last year.
NONE of your links addresses the most important tests of the AGW conjecture which makes most of their model driven papers moot. The lack of a Tropic "hot spot" and the 50% less per decade warming trend rate prediction/projection.
Permafrost melted out in part of southern Greenland that allowed Vikings to grow crops which are impossible today, yet no run away warming occurred. It was around 2C warmer than now in the early part of the interglacial, yet still no run away warming trend, heck it has NEVER happened in last 600 Million years.
Strong Positive feedbacks have NEVER existed because Water Vapor carries away a lot of "heat" from the surface as part of the CONVECTION process, which a significant NEGATIVE feedback.
Your delusions are based on modeling scenarios that are absurd.
Last edited:
What positive feedbacks?
Clueless in Paris.. Did you REALLY ask that question? After 5 or 7 years of filibustering this forum with all your scary doom and gloom accelerations and trigger points and runaway GW bovine excrement?
Similar threads
- Replies
- 118
- Views
- 2K
- Replies
- 221
- Views
- 4K
- Replies
- 584
- Views
- 12K
- Replies
- 330
- Views
- 8K
Latest Discussions
- Replies
- 1
- Views
- 23
- Replies
- 2K
- Views
- 30K
Forum List
-
-
-
-
-
Political Satire 8037
-
-
-
-
-
-
-
-
-
-
-
-
-
-
-
-
-
-
-
ObamaCare 781
-
-
-
-
-
-
-
-
-
-
-
Member Usernotes 468
-
-
-
-
-
-
-
-
-
-