Widdekind
Member
- Mar 26, 2012
- 813
- 35
- 16
i have difficulty following all the text and graphics.
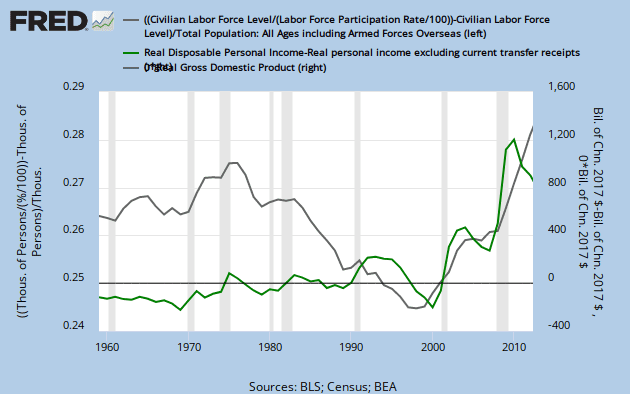
population = potential labor force + kids (<15)
= active labor force + inactive labor force + kids
= (employed + unemployed) + "discouraged" + kids
= working + looking + drinking + kids
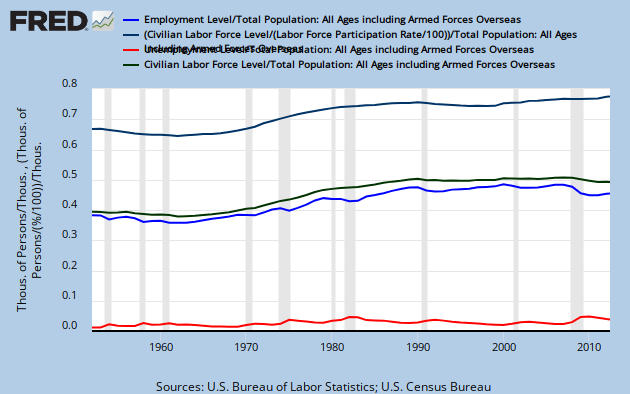
The following figure plots ratios, of employment-related levels (thousands of persons), to total population levels (thousands of persons):= active labor force + inactive labor force + kids
= (employed + unemployed) + "discouraged" + kids
= working + looking + drinking + kids
- potential labor force
- active labor force
- "working" labor force (E)
- "looking" labor force (UE)
Last edited: