The Last Two Novembers are the Warmest Novembers on Record

Last edited:
The Last Two Novembers are the Warmest Novembers on Record
Posted Dec. 15, 2016
Data.GISS: GISTEMP Update: Last Two Novembers are the Warmest Novembers on Record

Monthly temperature anomalies with base 1980-2015, superimposed on a 1980-2015 mean seasonal cycle. (Credit: NASA/GISS/Schmidt) — View larger image, PDF
November 2016 was the second warmest November in 136 years of modern record-keeping, according to a monthly analysis of global temperatures by scientists at NASA's Goddard Institute for Space Studies (GISS) in New York.

November 2016's temperature was 0.07 degrees Celsius cooler than the warmest November in 2015. Last month was 0.95 degrees Celsius warmer than the mean November temperature from 1951-1980.

The top two November temperature anomalies have been the past two years. 2015 was the hottest on record, at 1.02 degrees Celsius warmer than the November mean temperature, followed by 2016.


A map of the November 2016 LOTI (land-ocean temperature index) anomaly, showing that North America and especially the Arctic region were much warmer than average. Meanwhile central Russia was colder than normal. — View larger image
The monthly analysis by the GISS team is assembled from publicly available data acquired by about 6,300 meteorological stations around the world, ship- and buoy-based instruments measuring sea surface temperature, and Antarctic research stations.

The modern global temperature record begins around 1880 because previous observations didn't cover enough of the planet. Monthly analyses are sometimes updated when additional data becomes available, and the results are subject to change.

Hottest ever for the year.
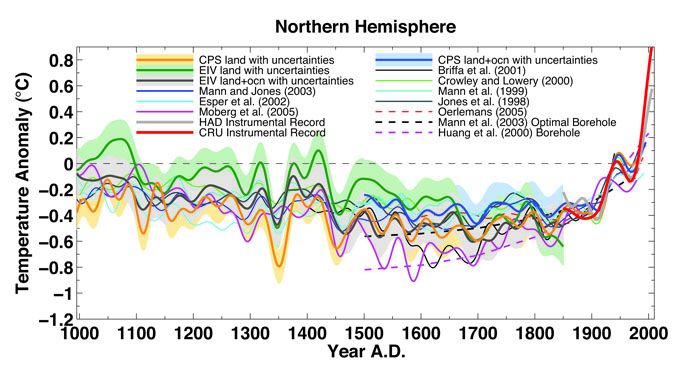
How cold was it in November in 1456?


Based on the proxies it was certainly colder than today. There's some error as there's quite a few records but I'd say around -.3c for the (assuming) the 20th century means.

fig4b.jpg
your arrogance is expected. Your little squiggly lines mean noting.
 
Where is your dataset?

Research? Peer review???

The thing is the scientist are the ones that do all this, while you and fox news most certainly don't. Before the thermometer was invented we have to answer such questions with proxies.

APP_global_temperature_proxy_data_v5.png
 
Last edited:
Where is your dataset?

Research? Peer review???

The thing is the scientist are the ones that do all this, while you and fox news most certainly doesn't.

APP_global_temperature_proxy_data_v5.png
Good Lord, Matthew, we are in an interglacial cycle. That's what happens in an interglacial cycle. What part of this do you not understand?

upload_2016-12-15_21-2-14.png
 
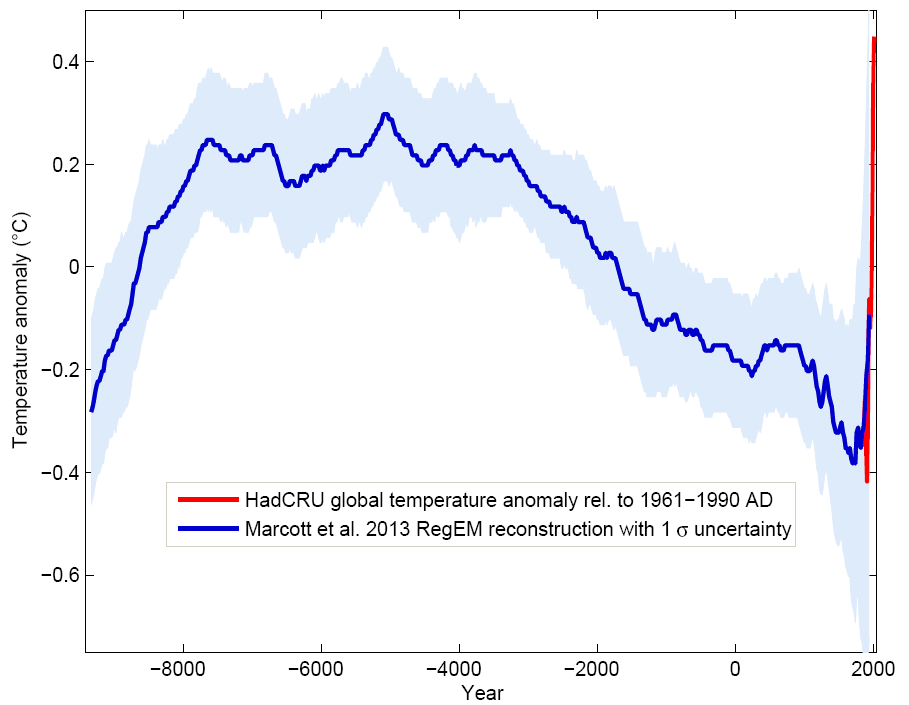
Based on the natural cycle we were cooling for the past 5,000 years from the height of the innerglacial.

Marcott.png


8579674565_c0fd53b616_c.jpg


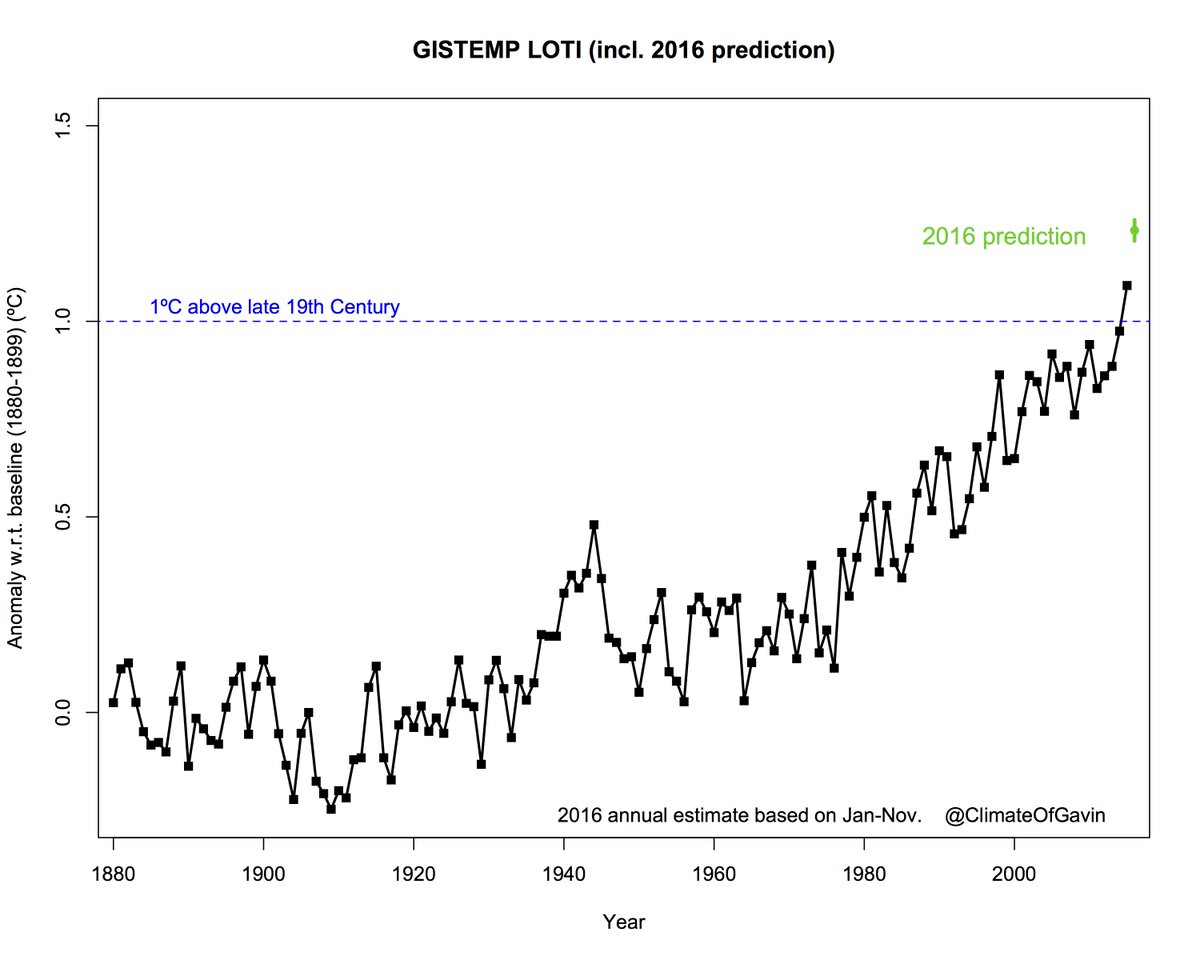
Matthew, that chart is an absolute bald faced lie...are you really claiming a temperature increase of more than 1 degree since 1960? Are you making that claim with a straight face? It is one thing to be a handwaving hysteric, which you certainly are, but another thing entirely to be a bald faced deliberate liar...which this graph strongly suggests that you are.
 
Are YOU suggesting that we have not experienced an extremely rapid temperature increase in the last century and a half? BTW, that graph does NOT show a 1 C rise and 1960 cannot be seen on it.
 
Based on the natural cycle we were cooling for the past 5,000 years from the height of the innerglacial.

Marcott.png


8579674565_c0fd53b616_c.jpg
Marcott.png


Hey, little buddy. You see the blue circle in the graph below? That the same data you are showing in the graph above. Now do you see all of those red circles on the graph below? Those are the exact same behaviors from previous interglacial cycles that you are seeing in your graph above. It is perfectly natural. We call this type of behavior stick-slip behavior. We see it in all kind of natural phenomenon. Seriously, it's going to be ok. I promise.

upload_2016-12-17_19-59-25.png
 
CzuwcGeXUAAqBjr.jpg


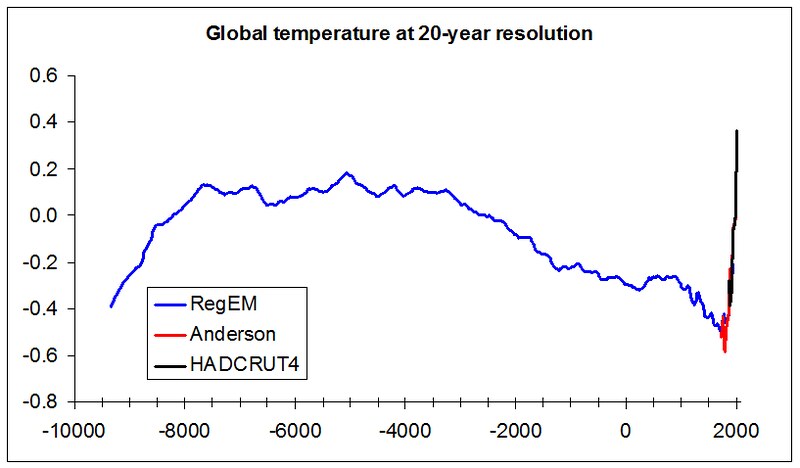
Mathew, little buddy, you see your graph above. You see the purple line in the graph below? That's the same data. It's just the graph below puts it into its proper context. It's going to be ok, little buddy. I promise.

upload_2016-12-17_20-3-29.png
 
The Last Two Novembers are the Warmest Novembers on Record
Posted Dec. 15, 2016
Data.GISS: GISTEMP Update: Last Two Novembers are the Warmest Novembers on Record

Monthly temperature anomalies with base 1980-2015, superimposed on a 1980-2015 mean seasonal cycle. (Credit: NASA/GISS/Schmidt) — View larger image, PDF
November 2016 was the second warmest November in 136 years of modern record-keeping, according to a monthly analysis of global temperatures by scientists at NASA's Goddard Institute for Space Studies (GISS) in New York.

November 2016's temperature was 0.07 degrees Celsius cooler than the warmest November in 2015. Last month was 0.95 degrees Celsius warmer than the mean November temperature from 1951-1980.

The top two November temperature anomalies have been the past two years. 2015 was the hottest on record, at 1.02 degrees Celsius warmer than the November mean temperature, followed by 2016.


A map of the November 2016 LOTI (land-ocean temperature index) anomaly, showing that North America and especially the Arctic region were much warmer than average. Meanwhile central Russia was colder than normal. — View larger image
The monthly analysis by the GISS team is assembled from publicly available data acquired by about 6,300 meteorological stations around the world, ship- and buoy-based instruments measuring sea surface temperature, and Antarctic research stations.

The modern global temperature record begins around 1880 because previous observations didn't cover enough of the planet. Monthly analyses are sometimes updated when additional data becomes available, and the results are subject to change.

Hottest ever for the year.
How cold was it in November in 1456?


Based on the proxies it was certainly colder than today. There's some error as there's quite a few records but I'd say around -.3c for the (assuming) the 20th century means.

fig4b.jpg
your arrogance is expected. Your little squiggly lines mean noting.
Not to an illiterate that cannot read even a simple graph. Those 'squiggly' lines show the rapid and accelerating warming of our world.
No. They show the natural climate behavior of an interglacial cycle.
 
Where is your dataset?

Research? Peer review???

The thing is the scientist are the ones that do all this, while you and fox news most certainly doesn't.

APP_global_temperature_proxy_data_v5.png
Good Lord, Matthew, we are in an interglacial cycle. That's what happens in an interglacial cycle. What part of this do you not understand?

View attachment 102256
What a lying fuck you are, Dingleberry. Let us look at the whole article, and what the scientists from NASA say.

Global Warming : Feature Articles

How is Today’s Warming Different from the Past?

Earth has experienced climate change in the past without help from humanity. We know about past climates because of evidence left in tree rings, layers of ice in glaciers, ocean sediments, coral reefs, and layers of sedimentary rocks. For example, bubbles of air in glacial ice trap tiny samples of Earth’s atmosphere, giving scientists a history of greenhouse gases that stretches back more than 800,000 years. The chemical make-up of the ice provides clues to the average global temperature.

See the Earth Observatory’s series Paleoclimatology for details about how scientists study past climates.

core_section.jpg

epica_temperature.png

Glacial ice and air bubbles trapped in it (top) preserve an 800,000-year record of temperature & carbon dioxide. Earth has cycled between ice ages (low points, large negative anomalies) and warm interglacials (peaks). (Photograph courtesy National Snow & Ice Data Center. NASA graph by Robert Simmon, based on data from Jouzel et al., 2007.)

Using this ancient evidence, scientists have built a record of Earth’s past climates, or “paleoclimates.” The paleoclimate record combined with global models shows past ice ages as well as periods even warmer than today. But the paleoclimate record also reveals that the current climatic warming is occurring much more rapidly than past warming events.

As the Earth moved out of ice ages over the past million years, the global temperature rose a total of 4 to 7 degrees Celsius over about 5,000 years. In the past century alone, the temperature has climbed 0.7 degrees Celsius, roughly ten times faster than the average rate of ice-age-recovery warming.

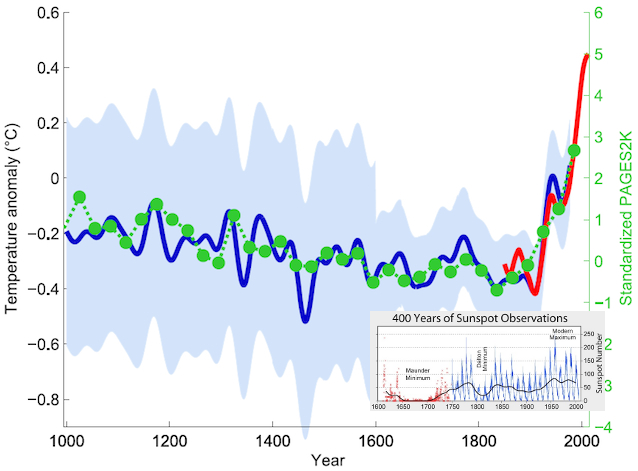
proxy-based_temperature_reconstruction.png

Temperature histories from paleoclimate data (green line) compared to the history based on modern instruments (blue line) suggest that global temperature is warmer now than it has been in the past 1,000 years, and possibly longer. (Graph adapted from Mann et al., 2008.)

Models predict that Earth will warm between 2 and 6 degrees Celsius in the next century. When global warming has happened at various times in the past two million years, it has taken the planet about 5,000 years to warm 5 degrees. The predicted rate of warming for the next century is at least 20 times faster. This rate of change is extremely unusual.


Global WarmingIs Current Warming Natural?|
Global Warming
Print this entire article
Subscribe Today

So you think that all of us are so dumb that we don't find sources? And this is about the fourth or fifth time I have posted this to demonstrate what a liar you are.
Lying fuck? Moi? No. I'm telling the truth. What exactly do you believe you have posted that makes you believe you have proved I am lying?

Some dumbasses like yourself make a big deal out of the rate at which temperature is rising relative to the rate it rose during the previous interglacial cycles. My answer to that is that it is not possible to make that comparison because we have many data points for the last 50 years but very few for the previous interglacial cycles.

For the red line below there are exactly two data points from the oxygen isotope curve which covers a time period of 6,957 years from 438,261 years ago to 431,304 years ago where the temperature rose by 8.3C. Dumbasses like yourself don't seem to be able to comprehend that during those 6,957 years the slope of the temperature could have changed many times and that no one can tell you if during that time that there was ever a period of time where the slope was the same as today because the data does not exist. There were only 2 data points for this time period. But simpleton idiots like yourself will continue to argue that the slope from 438,261 years ago to 431,304 just had to be constant at 0.001 C/yr.

For the blue line below there are exactly two data points from the oxygen isotope curve which covers a time period of 7,950 years from 342,857 years ago to 334,907 years ago where the temperature rose by 12.4C. Dumbasses like yourself don't seem to be able to comprehend that during those 7,950 years the slope of the temperature could have changed many times and that no one can tell you if that slope was the same as today because the data does not exist. There were only two data points for this time period. But simpleton idiots like yourself will continue to argue that the slope from 342,857 years ago to 334,907 just had to be constant at 0.002 C/yr.

For the orange line below there are exactly two data points from the oxygen isotope curve which covers a time period of 5,963 years from 252,422 years ago to 246,460 years ago where the temperature rose by 7.7C. Dumbasses like yourself don't seem to be able to comprehend that during those 5,963 years the slope of the temperature could have changed many times and that no one can tell you if during that time that there was ever a period of time where the slope was the same as today because the data does not exist. There were only two data points for this time period. But simpleton idiots like yourself will continue to argue that the slope from 252,422 years ago to 246,460 years ago just had to be constant at 0.001 C/yr.

For the black line below there are exactly two data points from the oxygen isotope curve which covers a time period of 11,925 years from 143,106 years ago to 131,180 years ago where the temperature rose by 7.7C. Dumbasses like yourself don't seem to be able to comprehend that during those 11,925 years the slope of the temperature could have changed many times and that no one can tell you if during that time that there was ever a period of time where the slope was the same as today because the data does not exist. There were only two data points for this time period. But simpleton idiots like yourself will continue to argue that the slope from 143,106 years ago to 131,180 years ago just had to be constant at 0.001 C/yr.

For the yellow line below there are exactly two data points from the oxygen isotope curve which covers a time period of 5,963 years from 18,876 years ago to 13,913 years ago where the temperature rose by 8.1C. Dumbasses like yourself don't seem to be able to comprehend that during those 5,963 years the slope of the temperature could have changed many times and that no one can tell you if during that time that there was ever a period of time where the slope was the same as today because the data does not exist. There were only two data points for this time period. But simpleton idiots like yourself will continue to argue that the slope from 18,876 years ago to 13,913 years ago just had to be constant at 0.001 C/yr.


upload_2016-12-16_15-53-51-png.102376
 
Are YOU suggesting that we have not experienced an extremely rapid temperature increase in the last century and a half? BTW, that graph does NOT show a 1 C rise and 1960 cannot be seen on it.

There is no temperature reconstruction proxy that would suggest the temperature increase we have seen is in any way unusual...and the ice core reconstructions which are the gold standard certainly don't support the claim that it is warming more rapidly now than at any other time....the claim is bullshit...and that claim along with all your others are going to be tested...in public...with nowhere to run....I hope you take time to watch...and buy stock in popcorn...cause everyone else will sure be watching..

Fig-2-Correction-of-MBH99-our-emulation-of-the-real-world-proxy-based-MBH99.png

mann2008.gif

PAGES2k_MBH99_sunspots.png
 

Forum List

Back
Top