The best case a lay person can make against AGW

Radiative Transfer Models
Radiative transfer models use fundamental physical equations and observations to translate this increased downward radiation into a radiative forcing, which effectively tells us how much increased energy is reaching the Earth's surface. Studies have shown that these radiative transfer models match up with the observed increase in energy reaching the Earth's surface with very good accuracy (Puckrin 2004). Scientists can then derive a formula for calculating the radiative forcing based on the change in the amount of each greenhouse gas in the atmosphere (Myhre 1998). Each greenhouse gas has a different radiative forcing formula, but the most important is that of CO2:

dF = 5.35 ln(C/Co)

Where 'dF' is the radiative forcing in Watts per square meter, 'C' is the concentration of atmospheric CO2, and 'Co' is the reference CO2concentration. Normally the value of Co is chosen at the pre-industrial concentration of 280 ppmv.

Now that we know how to calculate the radiative forcing associated with an increase in CO2, how do we determine the associated temperature change?
 
Climate sensitivity
As the name suggests, climate sensitivity is an estimate of how sensitive the climate is to an increase in a radiative forcing. The climate sensitivity value tells us how much the planet will warm or cool in response to a given radiative forcing change. As you might guess, the temperature change is proportional to the change in the amount of energy reaching the Earth's surface (the radiative forcing), and the climate sensitivity is the coefficient of proportionality:

dT = λ*dF

Where 'dT' is the change in the Earth's average surface temperature, 'λ' is the climate sensitivity, usually with units in Kelvin or degrees Celsius per Watts per square meter (°C/[W/m2]), and 'dF' is the radiative forcing.

So now to calculate the change in temperature, we just need to know the climate sensitivity. Studies have given a possible range of values of 2-4.5°C warming for a doubling of CO2 (IPCC 2007). Using these values it's a simple task to put the climate sensitivity into the units we need, using the formulas above:

λ = dT/dF = dT/(5.35 * ln[2])= [2 to 4.5°C]/3.7 = 0.54 to 1.2°C/(W/m2)

Using this range of possible climate sensitivity values, we can plug λ into the formulas above and calculate the expected temperature change. The atmospheric CO2 concentration as of 2010 is about 390 ppmv. This gives us the value for 'C', and for 'Co' we'll use the pre-industrial value of 280 ppmv.

dT = λ*dF = λ * 5.35 * ln(390/280) = 1.8 * λ

Plugging in our possible climate sensitivity values, this gives us an expected surface temperature change of about 1–2.2°C of global warming, with a most likely value of 1.4°C. However, this tells us the equilibrium temperature. In reality it takes a long time to heat up the oceans due to their thermal inertia. For this reason there is currently a planetary energy imbalance, and the surface has only warmed about 0.8°C. In other words, even if we were to immediately stop adding CO2 to the atmosphere, the planet would warm another ~0.6°C until it reached this new equilibrium state (confirmed by Hansen 2005). This is referred to as the 'warming in the pipeline'.

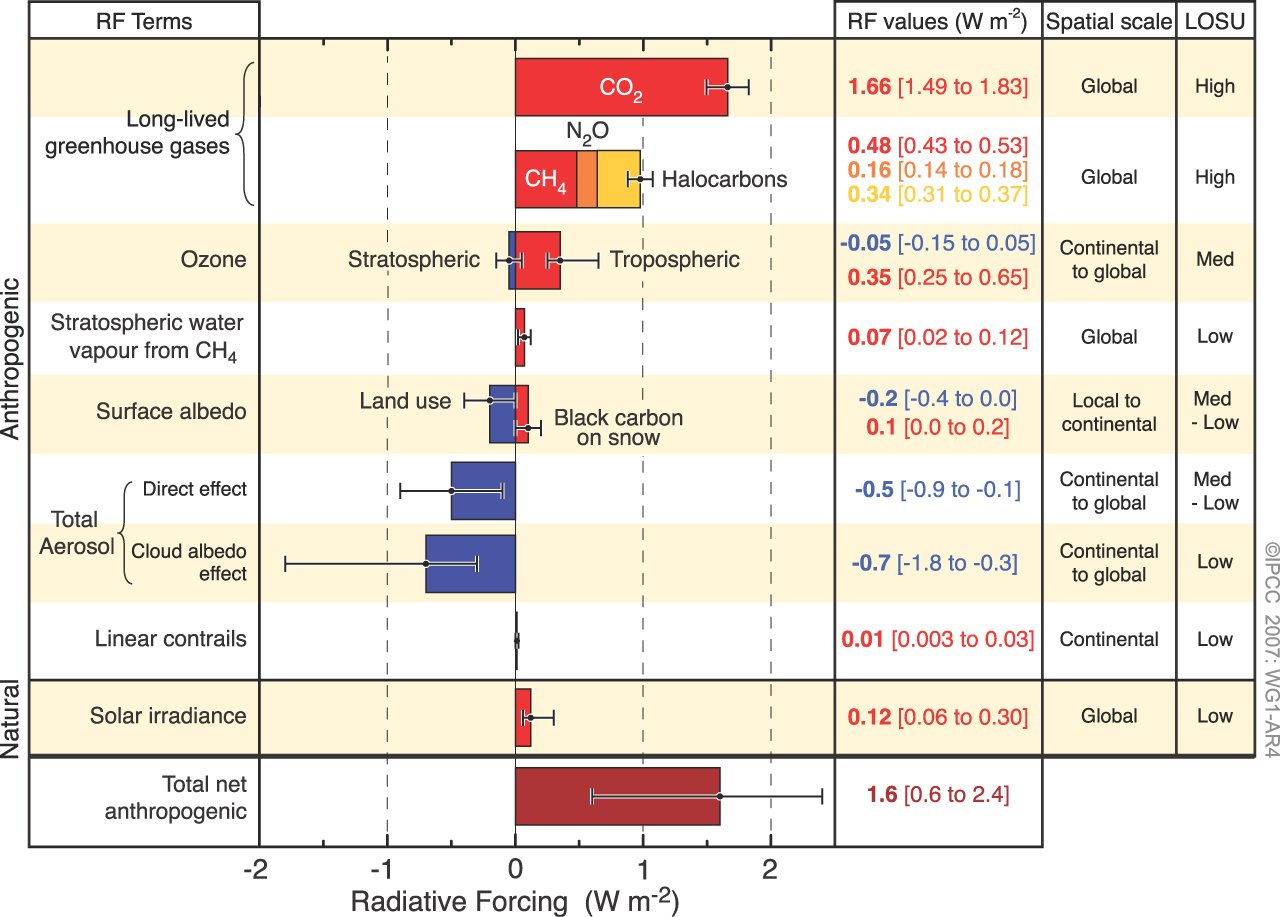
Of course this is just the temperature change we expect to observe from the CO2 radiative forcing. Humans cause numerous other radiative forcings, both positive (e.g. other greenhouse gases) and negative (e.g. sulfate aerosols which block sunlight). Fortunately, the negative and positive forcings are roughly equal and cancel each other out, and the natural forcings over the past half century have also been approximately zero (Meehl 2004), so the radiative forcing from CO2 alone gives us a good estimate as to how much we expect to see the Earth's surface temperature change.

figure-spm-2-l.png


Figure 4: Global average radiative forcing in 2005 (best estimates and 5 to 95% uncertainty ranges) with respect to 1750 (IPCC AR4).

We can also calculate the most conservative possible temperature change in response to the CO2 increase. Some climate scientists who are touted as 'skeptics' have suggested the actual climate sensitivity could be closer to 1°C for a doubling of CO2, or 0.27°C/(W/m2). Although numerous studies have ruled out climate sensitivity values this low, it's worth calculating how much of a temperature change this unrealistically low value would generate. Using the same formulas as above,

dT = 1.8 * λ = 1.8 * 0.27 = 0.5°C.

Therefore, even under this ultra-conservative unrealistic low climate sensitivity scenario, the increase in atmospheric CO2 over the past 150 years would account for over half of the observed 0.8°C increase in surface temperature.
 
Conservation of Energy
Huber and Knutti (2011) published a paper in Nature Geoscience, Anthropogenic and natural warming inferred from changes in Earth’s energy balance. They take an approach in this study which utilizes the principle of conservation of energy for the global energy budget using the measurements discussed above, and summarize their methodology:

"We use a massive ensemble of the Bern2.5D climate model of intermediate complexity, driven by bottom-up estimates of historic radiative forcing F, and constrained by a set of observations of the surface warming T since 1850 and heat uptake Q since the 1950s....Between 1850 and 2010, the climate system accumulated a total net forcing energy of 140 x 1022 J with a 5-95% uncertainty range of 95-197 x 1022 J, corresponding to an average net radiative forcing of roughly 0.54 (0.36-0.76)Wm-2."

Essentially, Huber and Knutti take the estimated global heat content increase since 1850, calculate how much of the increase is due to various estimated radiative forcings, and partition the increase between increasing ocean heat content and outgoing longwave radiation. The authors note that more than 85% of the global heat uptake (Q) has gone into the oceans, including increasing the heat content of the deeper oceans, although their model only accounts for the upper 700 meters.

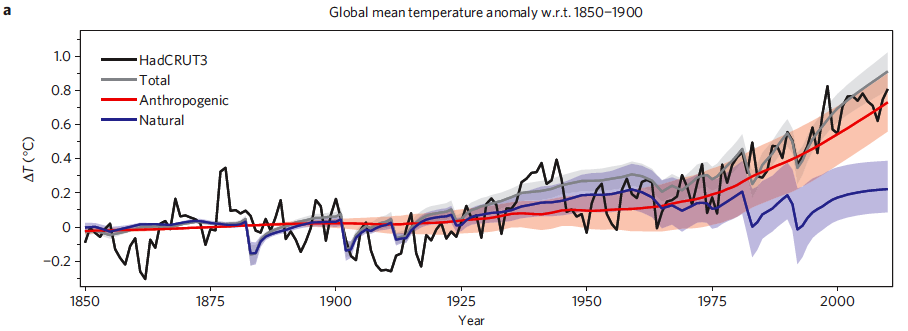
Figure 3 is a similar graphic to that presented in Meehl et al. (2004), comparing the average global surface warming simulated by the model using natural forcings only (blue), anthropogenic forcings only (red), and the combination of the two (gray).


Figure 3: Time series of anthropogenic and natural forcings contributions to total simulated and observed global temperature change. The coloured shadings denote the 5-95% uncertainty range.

In Figure 4, Huber and Knutti break down the anthropogenic and natural forcings into their individual components to quantify the amount of warming caused by each since the 1850s (Figure 4b), 1950s (4c), and projected from 2000 to 2050 using the IPCC SRES A2 emissions scenario as business-as-usual (4d).


Figure 4: Contributions of individual forcing agents to the total decadal temperature change for three time periods. Error bars denote the 5–95% uncertainty range. The grey shading shows the estimated 5–95% range for internal variability based on the CMIP3 climate models. Observations are shown as dashed lines.

As expected, Huber and Knutti find that greenhouse gases contributed to substantial warming since 1850, and aerosols had a significant cooling effect:

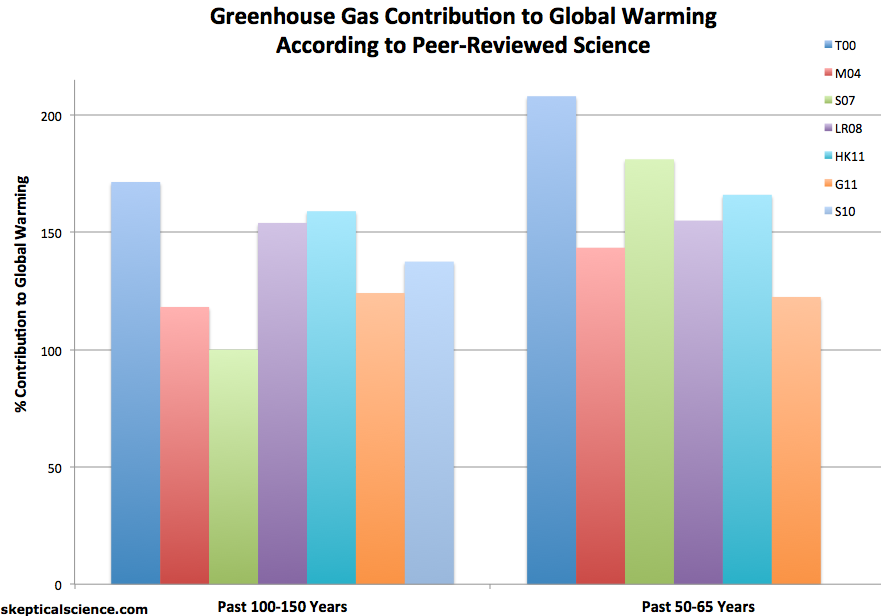
"Greenhouse gases contributed 1.31°C (0.85-1.76°C) to the increase, that is 159% (106-212%) of the total warming. The cooling effect of the direct and indirect aerosol forcing is about -0.85°C (-1.48 to -0.30°C). The warming induced by tropospheric ozone and solar variability are of similar size (roughly 0.2°C). The contributions of stratospheric water vapour and ozone, volcanic eruptions, and organic and black carbon are small."

Since 1950, the authors find that greenhouse gases contributed 166% (120-215%) of the observed surface warming (0.85°C of 0.51°C estimated surface warming). The percentage is greater than 100% because aerosols offset approximately 44% (0.45°C) of that warming.

"It is thus extremely likely (>95% probability) that the greenhouse gas induced warming since the mid-twentieth century was larger than the observed rise in global average temperatures, and extremely likely that anthropogenic forcings were by far the dominant cause of warming. The natural forcing contribution since 1950 is near zero."

A number of studies have used a variety of statistical and physical approaches to determine the contribution of greenhouse gases and other effects to the observed global warming, like Huber and Knutti. And like Huber and Knutti, they find that greenhouse gases have caused more warming than has been observed, because other factors have had a net cooling effect over the past century (Figure 5).


Figure 5: Greenhouse gas contribution to global warming according to various peer-reviewed attribution studies
 
All models all the time...and not the first shred of observed, measured, quantified, empirical data supporting the AGW hypothesis...a hypothesis relating to an observable, measurable, quantifiable entity....strange....don't you think?
 
Color you having not even looked at it. Shall we pull that page up piece by piece and you can try your damnedest to tell us what's wrong with their information? Sounds good to me.

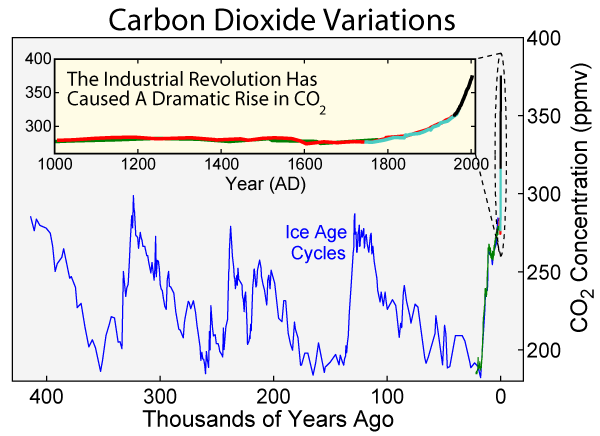
Carbon_Dioxide_400kyr_Rev.png

Figure 1: Carbon dioxide concentrations in the atmosphere over both the last 1000 years and the preceding 400,000 years as measured in ice cores

As a greenhouse gas, this increase in atmospheric CO2 increases the amount of downward longwave radiation from the atmosphere, including towards the Earth's surface.

Surface measurements of downward longwave radiation
The increase in atmospheric CO2 and other greenhouse gases has increased the amount of infrared radiation absorbed and re-emitted by these molecules in the atmosphere. The Earth receives energy from the Sun in the form of visible light and ultraviolet radiation, which is then re-radiated away from the surface as thermal radiation in infrared wavelengths. Some of this thermal radiation is then absorbed by greenhouse gases in the atmosphere and re-emitted in all directions, some back downwards, increasing the amount of energy bombarding the Earth's surface. This increase in downward infrared radiation has been observed through spectroscopy, which measures changes in the electromagnetic spectrum.


Figure 2: Spectrum of the greenhouse radiation measured at the surface. Greenhouse effect from water vapor is filtered out, showing the contributions of other greenhouse gases (Evans 2006).

Satellite measurements of outgoing longwave radiation
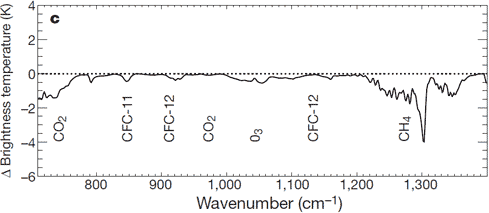
The increased greenhouse effect is also confirmed by NASA's IRIS satellite and the Japanese Space Agency's IMG satellite observing less longwave leaving the Earth's atmosphere.

harries_radiation.gif

Figure 3: Change in spectrum from 1970 to 1996 due to trace gases. 'Brightness temperature' indicates equivalent blackbody temperature (Harries 2001).

The increased energy reaching the Earth's surface from the increased greenhouse effect causes it to warm. So how do we quantify the amount of warming that it causes?
You really do have a rough time with graphing and what it is they intended to demonstrate. Yet not one of your copy and pastes implys or demonstrates your point.. Bravo... More useless crap from Crick..
 
Surface measurements of downward longwave radiation
The increase in atmospheric CO2 and other greenhouse gases has increased the amount of infrared radiation absorbed and re-emitted by these molecules in the atmosphere. The Earth receives energy from the Sun in the form of visible light and ultraviolet radiation, which is then re-radiated away from the surface as thermal radiation in infrared wavelengths. Some of this thermal radiation is then absorbed by greenhouse gases in the atmosphere and re-emitted in all directions, some back downwards, increasing the amount of energy bombarding the Earth's surface. This increase in downward infrared radiation has been observed through spectroscopy, which measures changes in the electromagnetic spectrum.


Figure 2: Spectrum of the greenhouse radiation measured at the surface. Greenhouse effect from water vapor is filtered out, showing the contributions of other greenhouse gases (Evans 2006).

Taken with an instrument cooled to a temperature of at least -80F...so it wasn't measuring radiation from the cooler atmosphere to the warmer earth...it was measuring radiation from the warmer atmosphere to the cooler instrument...had you set an instrument at ambient temperature right next to it, it would have shown no such measurements.
 
Satellite measurements of outgoing longwave radiation
The increased greenhouse effect is also confirmed by NASA's IRIS satellite and the Japanese Space Agency's IMG satellite observing less longwave leaving the Earth's atmosphere.

harries_radiation.gif

Figure 3: Change in spectrum from 1970 to 1996 due to trace gases. 'Brightness temperature' indicates equivalent blackbody temperature (Harries 2001).

The increased energy reaching the Earth's surface from the increased greenhouse effect causes it to warm. So how do we quantify the amount of warming that it causes?

You are just stuck on lie mode aren't you?....why not post the actual graph from Harries 2001 and say what it really means rather than post that bit of fluff as if it proved your point.....Here is the actual graph from the paper...

spectra2.gif


The red and blue lines are measurements taken by the IRIS instrument in 1970 on the Nimbus 4 spacecraft...the black line is the measurement taken by the IMG instrument on the Japanese ADEOS satellite in 1997...over a single location in the central pacific with no clouds...As you can see, in the CO2 band, the two are damned near identical after 27 years of steady atmospheric CO2 increase....In fact, the differences are so slight that they fall within the margin of error of the instruments themselves....The `spectral range' is given as 600-3,000 for IMG, and 400-1,600 for IRIS.....The `spatial field of view' is given as 8 km x 8 km for IMG, 100 km x 100 km for IRIS.....The `spectral resolution' is given as 0.1 to 0.25 for IMG, 2.8 for IRIS..the differences between the instruments are so different that some variation between their measurements is inevitable....


Either you are a bald faced liar, or too dumb to actually find out what the graph means before you post it....imagine, you trying to prove anything with a graph...what a laugh...
 
harries_radiation.gif

Figure 3: Change in spectrum from 1970 to 1996 due to trace gases. 'Brightness temperature' indicates equivalent blackbody temperature (Harries 2001).

You really do have a rough time with graphing and what it is they intended to demonstrate. Yet not one of your copy and pastes implys or demonstrates your point.. Bravo... More useless crap from Crick..

See my post just above for an explanation of what that graph actually means....as usual, crick is either a bone head moron who has no idea what the graph was actually about...or the paper he referenced....(Harries 2001)....or he is just a bald faced liar trying to trick anyone who isn't paying close attention....
Spectral output... and little or no change..

He doesn't have a clue what its use is either..

But he sure thought that that graph proved AGW.....it is really no wonder that he and people like him have been so thoroughly taken in by this whole scam....and the funny thing is that he claims to be an engineer...and not the custodial type...
 
You forget. You didn't ask for proof. You asked for evidence.
You are splitting hairs. We do not understand the GHG effect well enough to single out CO2. Correlation does not prove causation. Our temperatures are what they are due to natural processes which have been occuring for more than 3 million years.
 
You forget. You didn't ask for proof. You asked for evidence.

Here is a news flash for you skid mark...that isn't evidence that supports the AGW hypothesis...when the entire story is presented...it is evidence that the AGW hypothesis is terribly flawed....after 27 years of steady increase in atmospheric CO2, the difference in outgoing IR in the CO2 wavelengths is less than the margin of error between the two machines...what your graph proves is that increased CO2 isn't having any effect at the top of the atmosphere...yet one more prediction made by the AGW hypothesis that flopped.

You really should not try to use graphs...it is clear that you don't know what they mean and every time you use one it backfires....an intelligent person would detect a pattern and take appropriate avoidance action...you don't...guess that is a statement in itself.
 
You forget. You didn't ask for proof. You asked for evidence.
The proof is, climate change happens. We need better technologies to "bail us out of it".

I will agree that if money is to be spent on climate change, it should be put into adaptation rather than the futile attempt to control the climate.
Could depend on advances in fusion (an energy with a future); it could supply power for advances in terraforming and reclamation on Earth, not only for fun and practice, but also to encourage active participation in rational choice theory.
 
I think at this point, we don't know nearly enough to start terraforming the earth....back in the 70's during the ice age scare, there was talk of spreading black soot over the arctic and antarctic to trap heat....where might that have led?

Any attempt at terraforming at this point would be an invitation to disaster.
 
You forget. You didn't ask for proof. You asked for evidence.
The proof is, climate change happens. We need better technologies to "bail us out of it".
That probably does not exist because CO2 probably does not drive climate change, but if they were serious about it, they would look into Azolla.
what about fusion (an energy with a future) to lower global sea levels with pumps and desalination, and with better aqueducts, move water to where it may be needed.
 
I think at this point, we don't know nearly enough to start terraforming the earth....back in the 70's during the ice age scare, there was talk of spreading black soot over the arctic and antarctic to trap heat....where might that have led?

Any attempt at terraforming at this point would be an invitation to disaster.
aqueducts could eliminate droughts on Earth.
 

Forum List

Back
Top