The Arctic Is In Even Worse Shape Than You Realize

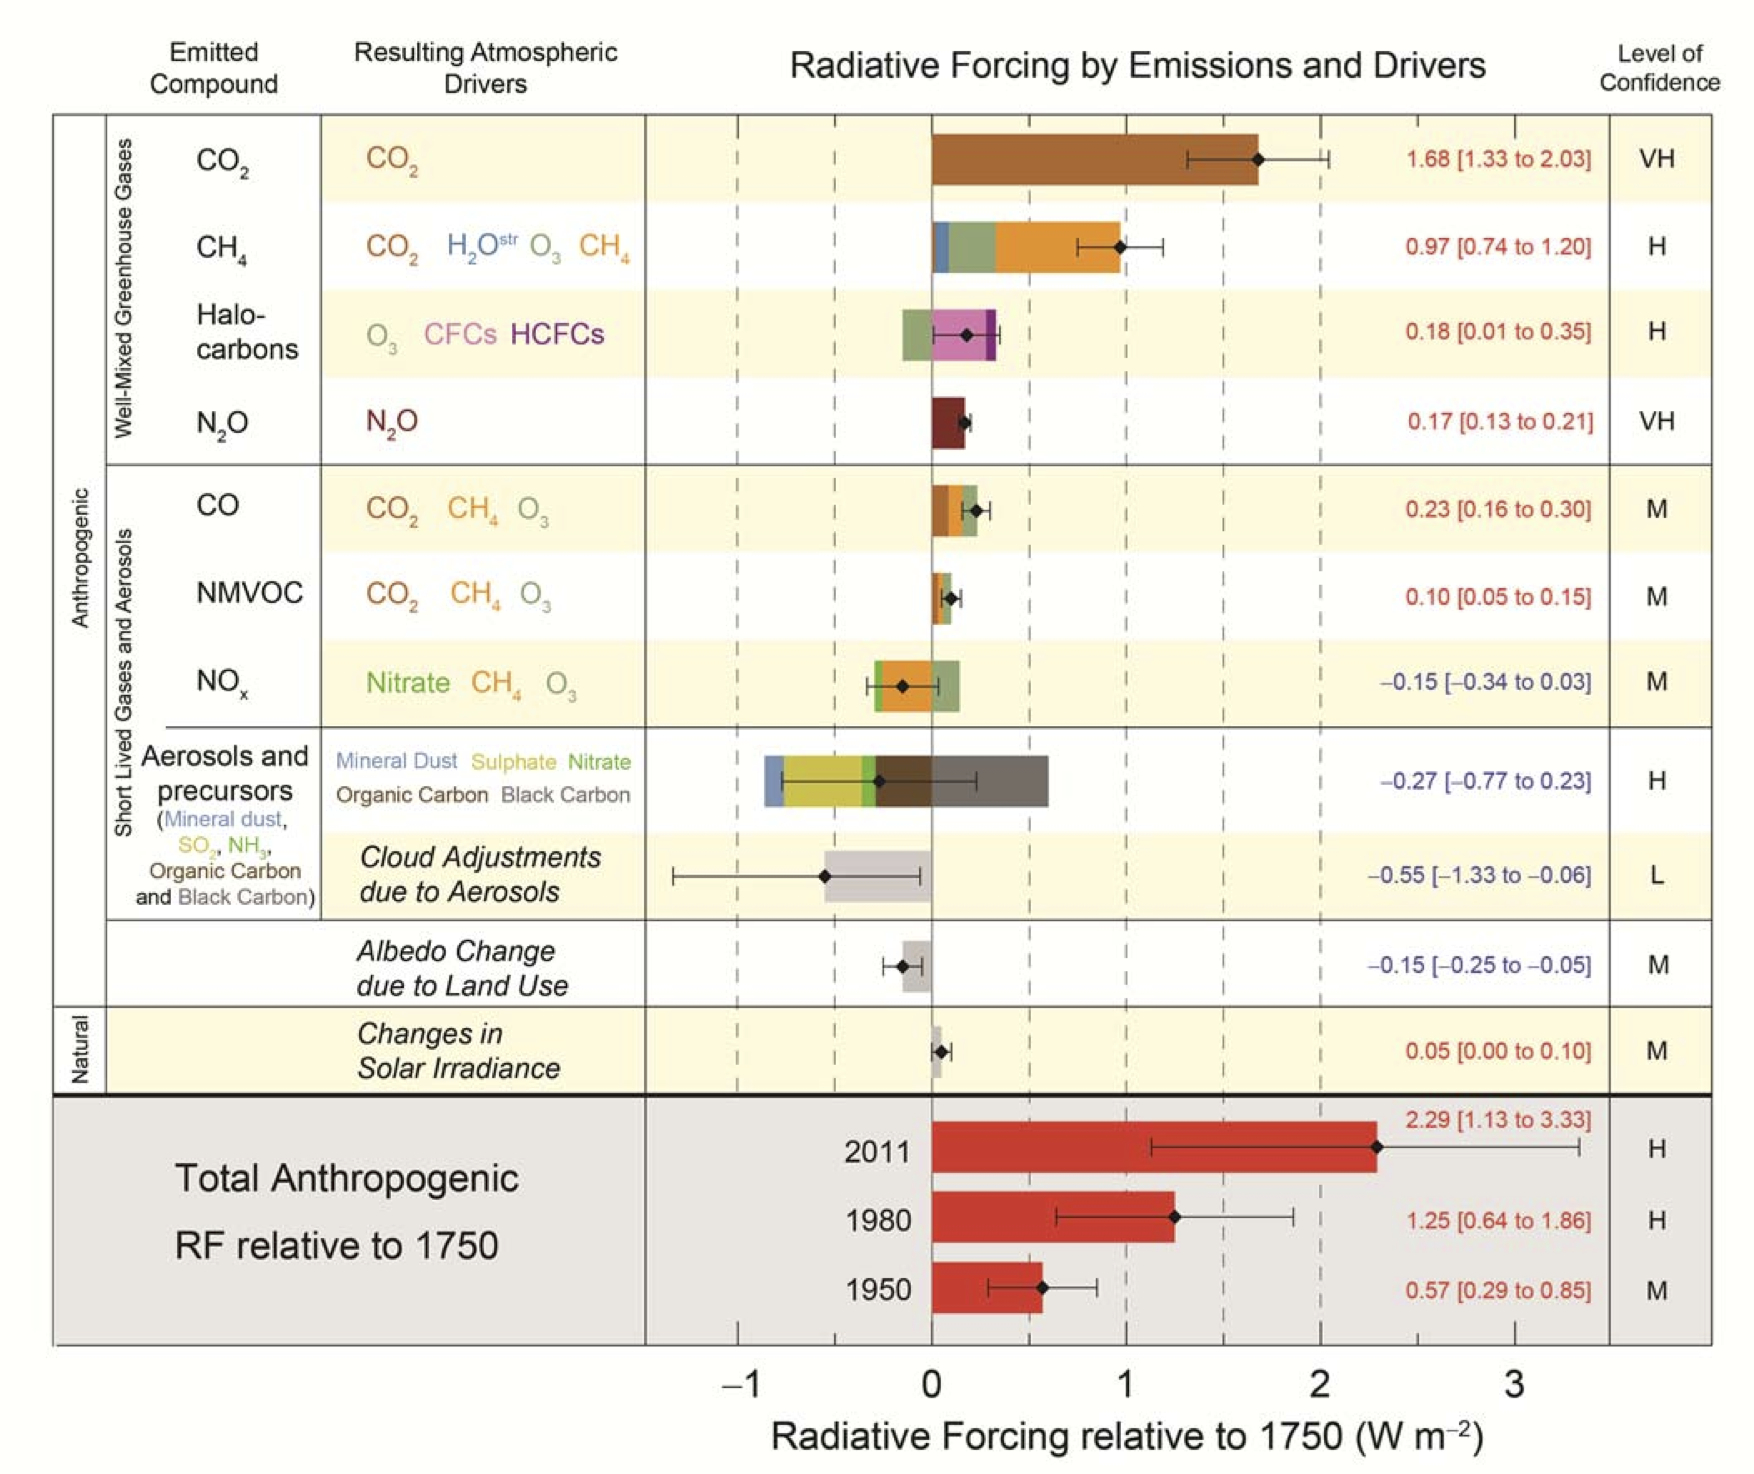
No, there is not. The changes in solar irradiance are trivial compared to the changes due to increased greenhouse warming.

CO2 is at the top. Changes in solar is at the bottom. This is from AR5 at www.ipcc.ch.

ipcc_rad_forc_ar5.jpg
 
No, there is not. The changes in solar irradiance are trivial compared to the changes due to increased greenhouse warming.

CO2 is at the top. Changes in solar is at the bottom. This is from AR5 at www.ipcc.ch.

ipcc_rad_forc_ar5.jpg
Yeah! That big yellow thing in the sky has almost no effect on Earth's climate!
 
Solar irradiance changes, but it simply is NOT changing as much as greenhouse forcing, fool.
 
Ha ha ha, I see that all the warmists in this thread has completely ignored my post #34 that counters the Mooneys typically misleading dishonest claims. They don't want to understand that Mooney is Bsing them as usual.
 
Ok Climate Alarmist dumbasses.....
Here's what it would look like if you put EVERY HUMAN ON EARTH into one building.....
Sorry, ther's just not enough of us to pollute the Earth through normal activities.
The SUN on the other hand.....that's an entirely different ballgame. The Sun puts more energy into the Earth per hour than man can generate through fusion (nuclear), fossil and all other sources combined PER YEAR.
Let's say it again....for Climate Change reality, look to the SUN
Cube1.jpg
 
"Denier" is not a word you'll find in ANY scientific literature; it's a secret cult handshake word used by members of the Lunatic Fringe AGW Cult

Denier is what you've been taught to parrot , which has little to no scientific relevance at all Frank

~S~
 
Graphs of sea ice extent begin in 1979 because that is when the satellite data begin you fool.

Here is the real data.

piomas-trnd2.png


No one here is relying on Chris Mooney for Arctic ice extent data or analysis. By far, the most common source quoted here is NSIDC
 
The Arctic is in even worse shape than you realize

Over the past three decades of global warming, the oldest and thickest ice in the Arctic has declined by a stunning 95 percent, according the National Oceanic and Atmospheric Administration’s annual Arctic Report Card.

A very dramatic video here:


You folks really are in panic mode.. This lie is another easily debunked.. Are you aware the Arctic has been ICE FREE 5 time during this interglacial alone and it had nothing to do with CO2...
 
Graphs of sea ice extent begin in 1979 because that is when the satellite data begin you fool.

Here is the real data.

piomas-trnd2.png


No one here is relying on Chris Mooney for Arctic ice extent data or analysis. By far, the most common source quoted here is NSIDC

And Crick posts a warming phase of the sun while ignoring the last cooling phase of our sun.. I wonder why that is?
 
The Arctic is in even worse shape than you realize

Over the past three decades of global warming, the oldest and thickest ice in the Arctic has declined by a stunning 95 percent, according the National Oceanic and Atmospheric Administration’s annual Arctic Report Card.

A very dramatic video here:

Get back to us when Eskimos stop telling their women, Baby, it's cold outside.

It will be too late by then.

History and the facts call you out as a hysterical left wing nutcase...
 
The Arctic is in even worse shape than you realize

Over the past three decades of global warming, the oldest and thickest ice in the Arctic has declined by a stunning 95 percent, according the National Oceanic and Atmospheric Administration’s annual Arctic Report Card.

A very dramatic video here:


BWAHAHAHAHAHAHAHA!!!

Another Chris Mooney babble quickly swallowed up by the resident warmist ignoramuses. Don't you warmists ever tire of being mislead by loony Mooney?

First of all they start at 1979 as pointed out by loony Mooney himself:

"Over the past three decades of global warming, the oldest and thickest ice in the Arctic has declined by a stunning 95 percent, according the National Oceanic and Atmospheric Administration’s annual Arctic Report Card."

While IGNORING the rest of the Interglacial before 1979, that is a special kind of stupid especially when they are saying we are in big trouble now, but no big deal in previous centuries of far less ice to NO Summer ice, yet no dire apocalypse ever showed up. The Polar Bears, Eskimos and gosh even unfrosted Al $$$ Gore are here today.

Mooney doesn't want you to know that DESPITE a significant reduction of Multi-Ice, there has been NO MORE DECLINE since 2007 in ice cover extent.

View attachment 234203
Stop embarrassing yourself by taking Christopher Mooney seriously.

Excellent Post!

The alarmists are counting on the ignorance of the people to take away your rights. I am informing as many as a I can about the historical facts...
 
Graphs of sea ice extent begin in 1979 because that is when the satellite data begin you fool.

Here is the real data.

piomas-trnd2.png


No one here is relying on Chris Mooney for Arctic ice extent data or analysis. By far, the most common source quoted here is NSIDC

Once again you failed to address post #34 where I posted the chart you ignored:

arctic-ice-august07to18final-png.234203


MASIE and SII are from the NSIDC and NIC

The DECLINE has stopped.
 
Last edited:
The Arctic is in even worse shape than you realize

Over the past three decades of global warming, the oldest and thickest ice in the Arctic has declined by a stunning 95 percent, according the National Oceanic and Atmospheric Administration’s annual Arctic Report Card.

A very dramatic video here:


You folks really are in panic mode.. This lie is another easily debunked.. Are you aware the Arctic has been ICE FREE 5 time during this interglacial alone and it had nothing to do with CO2...


I have a number of published papers showing that, but warmists treat it like leprosy...…, but here is one from 1975:

Taylor & Francis online

Birds and Climatic Change

Kenneth Williamson (1975) Birds and Climatic Change, Bird Study, 22:3,143-164, DOI: 10.1080/00063657509476459

Published online: 24 Jun 2009

“HISTORICAL REVIEW

Between 1000 and 1300 average summer temperatures were about 1°C higher than today, with the mean annual temperature higher by perhaps 4°C in a largely ice-free Arctic. Eric the Red, a renowned world citizen of that time, has been much maligned as the first progressive publicity man for giving Greenland a false image in order to attract settlers; but in truth, the southwest of that vast country was warmer and greener by far than at any time until the Fieldfares Turdus pilaris arrived there in the mid-1930s. The sea-temperature of the Atlantic was higher than it has been since, and there appears to have been none or very little ice to hinder the Vikings’ communications between Iceland, Greenland,Newfoundland and Labrador (Mowat 1965). Indeed Brooks (1926) considers that the polar ice-cap may have disappeared entirely during the summer months, to build anew each winter.”

LINK
 
Global dimming has been proven. 10 to 30 percent less sunlight is reaching earth. So how in the fuck can the artic be melting? Geo engineering and weather modification via ionispheric heaters be the answer?

20181023_175501.jpg
 
No, there is not. The changes in solar irradiance are trivial compared to the changes due to increased greenhouse warming.

CO2 is at the top. Changes in solar is at the bottom. This is from AR5 at www.ipcc.ch.

ipcc_rad_forc_ar5.jpg
You really are an ignorant idiot... Do you know why we give solids a 4X heat capability over the atmosphere? If the sun decreases just 1W/m^2 the effect will be magnified by 4 in our atmosphere as the black bodies will cool and the energy necessary to warm the atmosphere will be reduced BY A FACTOR OF FOUR.

You really don't have a fucking clue when it comes to how the atmosphere works..
 

Forum List

Back
Top