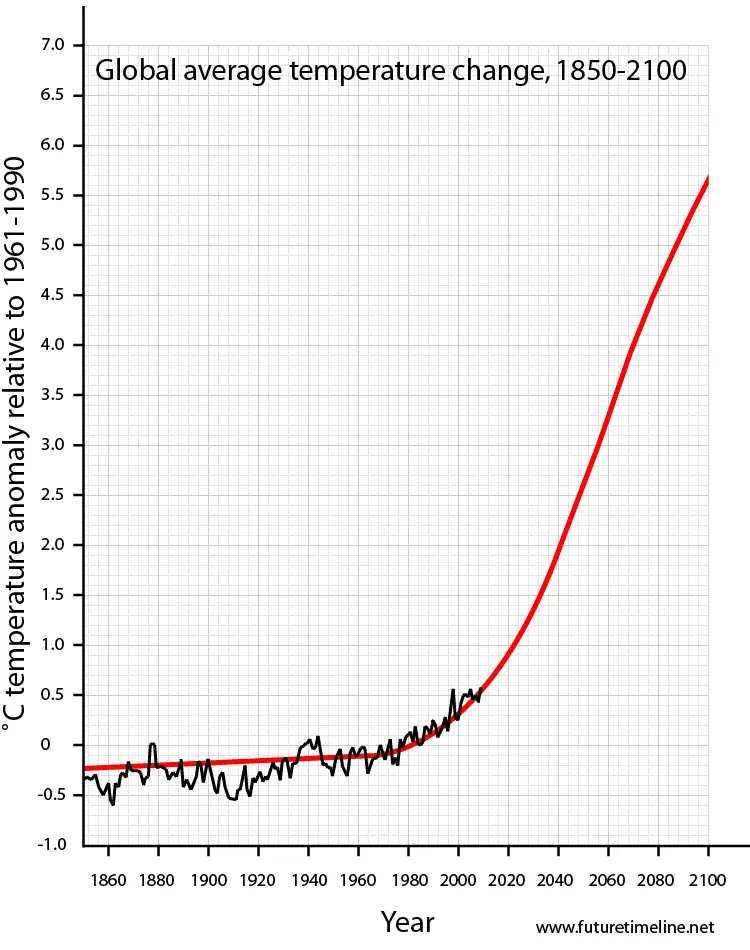
Temperture prediction graph..

Curious readers of this particular thread should ask themselves..........

If the AGW alarmists are so confident about their positions on this topic, why is it when they post, you invariably get these angry, miserable verbal tirades screaming at other members as being "retard"......"moron"......."lunatic"...........

Perhaps because the sane people have to deal with retarded, lunatic morons like you, kooksucker.
 
Lol I stumbled on the graph looking for something else... Talk about fear mongering. Remind me when they can tell us what the weather is next Saturday...

global-warming-timeline-future-2050.jpg

You are a true moron, barefarts, ignorant, clueless, retarded and full of misinformation and bullshit.

In the real world inhabited by intelligent people.....

‘We can’t even predict the weather next week’–But weather is not climate
Grist
By Coby Beck
Nov 22, 2006
Denier myth: 'Scientists can’t even predict the weather next week, so why should we believe what some climate model tells us about 100 years from now?'

Answer: Climate and weather are very different things, and the level of predictability is comparably different.

Climate is defined as weather averaged over a period of time — generally around 30 years. This averaging smooths out the random and unpredictable behaviour of weather. Think of it as the difference between trying to predict the height of the fifth wave from now versus predicting the height of tomorrow’s high tide. The former is a challenge — to which your salty, wet sneakers will bear witness — but the latter is routine and reliable.

This is not to say it’s easy to predict climate changes. But seizing on meteorologists’ failures to cast doubt on a climate model’s 100-year projection is an argument of ignorance.


So the graph represents the very probably pretty accurate, science based forecasts of the professional climate scientists at the National Oceanic and Atmospheric Administration, working with the best data available.

And your sneering denigration of that graph in your moronic OP, and your idiotic comparison of long range climate prediction and weather prediction (debunked in post #11) are both based on your severe retardation, utter ignorance and lack of education, and, of course, the massive brainwashing by anti-science fossil fuel industry propaganda, delivered to your little confused brain by Rush, FauxNews, Breitbart, and all of the other pushers of fraudulent rightwingnut propaganda and lies.

You didn't debunk anything I showed how foolish once again you and your ilk really are.

There you are retardedly denying reality again, barefarts. Of course I debunked your moronic OP. The graph is based on real science from the scientists at NOAA......and climate prediction is very different from weather prediction, as was well explained in post #11. The only thing you "showed" us was how ignorant, retarded and anti-science you really are.


It's propaganda going to the extreme... I was the one to produce the real one not you...(like you would ever produce facts and not hyperbole anyways)


.
 
The moronic OP was completely debunked in post #11.

Only denier cult retards disagree.


Funny how Micheal Mann only used tree ring samples from Siberia....yet you worship him....


Actually it was from a SINGLE tree in the entire grove. The rest of the grove showed nothing special.
 
The moronic OP was completely debunked in post #11.

Only denier cult retards disagree.
Stuck in libtard fantasy land.. It doesn't matter to you that natural variation is NEVER considered by your cult? You don't believe in science, you believe in fairy-tales..
Jeeeez,you are soooooo retarded!

What the hell do you imagine that "natural variation" has to do with the explanation in post #11 of the important differences between short term weather prediction and long term climate prediction, boober?
 
The moronic OP was completely debunked in post #11.

Only denier cult retards disagree.


Funny how Micheal Mann only used tree ring samples from Siberia....yet you worship him....


Actually it was from a SINGLE tree in the entire grove. The rest of the grove showed nothing special.
As part of his Phd research, Michael E. Mann worked with seismologist Jeffrey Park on developing statistical techniques for find long term oscillations of natural variability in the instrumental temperature record of global surface temperatures over the last 140 years; Mann & Park 1993 showed patterns relating to the El Niño–Southern Oscillation, and Mann & Park 1994 found what was later termed the Atlantic multidecadal oscillation. They then teamed up with Raymond S. Bradley to use these techniques on the dataset from his Bradley & Jones 1993 study with the aim of finding long term oscillations of natural variability in global climate. The resulting reconstruction went back to 1400, and was published in November as Mann, Park & Bradley 1995. They were able to detect that the multiple proxies were varying in a coherent oscillatory way, indicating both the multidecadal pattern in the North Atlantic and a longer term oscillation of roughly 250 years in the surrounding region. Their study did not calibrate these proxy patterns against a quantitative temperature scale, and a new statistical approach was needed to find how they related to surface temperatures in order to reconstruct past temperature patterns.[37][38]

Mann, Bradley and Hughes 1998[edit]
For his postdoctoral research Mann joined Bradley and tree ring specialist Malcolm K. Hughes to develop a new statistical approach to reconstruct underlying spatial patterns of temperature variation combining diverse datasets of proxy information covering different periods across the globe, including a rich resource of tree ring networks for some areas and sparser proxies such as lake sediments, ice cores and corals, as well as some historical records.[39]

Hockey stick graph - Wikipedia

What a fucked up liar you are, Mr. Westwall. Go ahead and show us a link from a credible source that states that the Mann Graph was made from one tree.
 
The moronic OP was completely debunked in post #11.

Only denier cult retards disagree.


Funny how Micheal Mann only used tree ring samples from Siberia....yet you worship him....


Actually it was from a SINGLE tree in the entire grove. The rest of the grove showed nothing special.
Mann conveniently threw away the data that proved his hypothesis wrong. And focused only on that which would forward his cult and their world domination idiocies.
 
The moronic OP was completely debunked in post #11.

Only denier cult retards disagree.


Funny how Micheal Mann only used tree ring samples from Siberia....yet you worship him....


Actually it was from a SINGLE tree in the entire grove. The rest of the grove showed nothing special.
As part of his Phd research, Michael E. Mann worked with seismologist Jeffrey Park on developing statistical techniques for find long term oscillations of natural variability in the instrumental temperature record of global surface temperatures over the last 140 years; Mann & Park 1993 showed patterns relating to the El Niño–Southern Oscillation, and Mann & Park 1994 found what was later termed the Atlantic multidecadal oscillation. They then teamed up with Raymond S. Bradley to use these techniques on the dataset from his Bradley & Jones 1993 study with the aim of finding long term oscillations of natural variability in global climate. The resulting reconstruction went back to 1400, and was published in November as Mann, Park & Bradley 1995. They were able to detect that the multiple proxies were varying in a coherent oscillatory way, indicating both the multidecadal pattern in the North Atlantic and a longer term oscillation of roughly 250 years in the surrounding region. Their study did not calibrate these proxy patterns against a quantitative temperature scale, and a new statistical approach was needed to find how they related to surface temperatures in order to reconstruct past temperature patterns.[37][38]

Mann, Bradley and Hughes 1998[edit]
For his postdoctoral research Mann joined Bradley and tree ring specialist Malcolm K. Hughes to develop a new statistical approach to reconstruct underlying spatial patterns of temperature variation combining diverse datasets of proxy information covering different periods across the globe, including a rich resource of tree ring networks for some areas and sparser proxies such as lake sediments, ice cores and corals, as well as some historical records.[39]

Hockey stick graph - Wikipedia

What a fucked up liar you are, Mr. Westwall. Go ahead and show us a link from a credible source that states that the Mann Graph was made from one tree.
One tree, several other incompatible proxies and one made up pile of shit from a failed model.. which made up the hokey schtick..
 
The moronic OP was completely debunked in post #11.

Only denier cult retards disagree.


Funny how Micheal Mann only used tree ring samples from Siberia....yet you worship him....


Actually it was from a SINGLE tree in the entire grove. The rest of the grove showed nothing special.
As part of his Phd research, Michael E. Mann worked with seismologist Jeffrey Park on developing statistical techniques for find long term oscillations of natural variability in the instrumental temperature record of global surface temperatures over the last 140 years; Mann & Park 1993 showed patterns relating to the El Niño–Southern Oscillation, and Mann & Park 1994 found what was later termed the Atlantic multidecadal oscillation. They then teamed up with Raymond S. Bradley to use these techniques on the dataset from his Bradley & Jones 1993 study with the aim of finding long term oscillations of natural variability in global climate. The resulting reconstruction went back to 1400, and was published in November as Mann, Park & Bradley 1995. They were able to detect that the multiple proxies were varying in a coherent oscillatory way, indicating both the multidecadal pattern in the North Atlantic and a longer term oscillation of roughly 250 years in the surrounding region. Their study did not calibrate these proxy patterns against a quantitative temperature scale, and a new statistical approach was needed to find how they related to surface temperatures in order to reconstruct past temperature patterns.[37][38]

Mann, Bradley and Hughes 1998[edit]
For his postdoctoral research Mann joined Bradley and tree ring specialist Malcolm K. Hughes to develop a new statistical approach to reconstruct underlying spatial patterns of temperature variation combining diverse datasets of proxy information covering different periods across the globe, including a rich resource of tree ring networks for some areas and sparser proxies such as lake sediments, ice cores and corals, as well as some historical records.[39]

Hockey stick graph - Wikipedia

What a fucked up liar you are, Mr. Westwall. Go ahead and show us a link from a credible source that states that the Mann Graph was made from one tree.


You shouldn't use wiki it's getting bad lately..


.
 
The moronic OP was completely debunked in post #11.

Only denier cult retards disagree.


Funny how Micheal Mann only used tree ring samples from Siberia....yet you worship him....


Actually it was from a SINGLE tree in the entire grove. The rest of the grove showed nothing special.
As part of his Phd research, Michael E. Mann worked with seismologist Jeffrey Park on developing statistical techniques for find long term oscillations of natural variability in the instrumental temperature record of global surface temperatures over the last 140 years; Mann & Park 1993 showed patterns relating to the El Niño–Southern Oscillation, and Mann & Park 1994 found what was later termed the Atlantic multidecadal oscillation. They then teamed up with Raymond S. Bradley to use these techniques on the dataset from his Bradley & Jones 1993 study with the aim of finding long term oscillations of natural variability in global climate. The resulting reconstruction went back to 1400, and was published in November as Mann, Park & Bradley 1995. They were able to detect that the multiple proxies were varying in a coherent oscillatory way, indicating both the multidecadal pattern in the North Atlantic and a longer term oscillation of roughly 250 years in the surrounding region. Their study did not calibrate these proxy patterns against a quantitative temperature scale, and a new statistical approach was needed to find how they related to surface temperatures in order to reconstruct past temperature patterns.[37][38]

Mann, Bradley and Hughes 1998[edit]
For his postdoctoral research Mann joined Bradley and tree ring specialist Malcolm K. Hughes to develop a new statistical approach to reconstruct underlying spatial patterns of temperature variation combining diverse datasets of proxy information covering different periods across the globe, including a rich resource of tree ring networks for some areas and sparser proxies such as lake sediments, ice cores and corals, as well as some historical records.[39]

Hockey stick graph - Wikipedia

What a fucked up liar you are, Mr. Westwall. Go ahead and show us a link from a credible source that states that the Mann Graph was made from one tree.


You shouldn't use wiki it's getting bad lately..


.
"lately"

Hell its been a wreck for a hell of a long time... William Connolly was doing his alarmist thing for quite some time editing articles and putting a very left wing socialist slant on the whole mess..
 
Actually it was from a SINGLE tree in the entire grove. The rest of the grove showed nothing special.

Here's some discussions of the issue that debunk that brazen lie.

Yamal controversy - RationalWiki

Hey Ya! (mal)

Yes, that talks about actual science, hence the deniers here will all auto-scream it's a big fake.

The deniers here don't even try to discuss the science any more. No matter what the topic is, they just insta-scream that all the data is being faked by scary socialists. Every one of 'em is an ignorant cult troll, hellbent on their mission to shut down all rational discussion.

That's right, deniers. The whole planet is wrong, and only your tiny fringe political cult understands the RealTruth. I bet it makes you feel all tingly and important to believe that. You don't have to do anything except curse at your moral and intellectual betters, and you get proclaim how that makes you a superior human being. You get a huge emotional payoff for being lazy sociopaths. That kind of emotional lure must be irresistible to weak and immoral minds.
 
The moronic OP was completely debunked in post #11.

Only denier cult retards disagree.


Funny how Micheal Mann only used tree ring samples from Siberia....yet you worship him....


Actually it was from a SINGLE tree in the entire grove. The rest of the grove showed nothing special.
As part of his Phd research, Michael E. Mann worked with seismologist Jeffrey Park on developing statistical techniques for find long term oscillations of natural variability in the instrumental temperature record of global surface temperatures over the last 140 years; Mann & Park 1993 showed patterns relating to the El Niño–Southern Oscillation, and Mann & Park 1994 found what was later termed the Atlantic multidecadal oscillation. They then teamed up with Raymond S. Bradley to use these techniques on the dataset from his Bradley & Jones 1993 study with the aim of finding long term oscillations of natural variability in global climate. The resulting reconstruction went back to 1400, and was published in November as Mann, Park & Bradley 1995. They were able to detect that the multiple proxies were varying in a coherent oscillatory way, indicating both the multidecadal pattern in the North Atlantic and a longer term oscillation of roughly 250 years in the surrounding region. Their study did not calibrate these proxy patterns against a quantitative temperature scale, and a new statistical approach was needed to find how they related to surface temperatures in order to reconstruct past temperature patterns.[37][38]

Mann, Bradley and Hughes 1998[edit]
For his postdoctoral research Mann joined Bradley and tree ring specialist Malcolm K. Hughes to develop a new statistical approach to reconstruct underlying spatial patterns of temperature variation combining diverse datasets of proxy information covering different periods across the globe, including a rich resource of tree ring networks for some areas and sparser proxies such as lake sediments, ice cores and corals, as well as some historical records.[39]

Hockey stick graph - Wikipedia

What a fucked up liar you are, Mr. Westwall. Go ahead and show us a link from a credible source that states that the Mann Graph was made from one tree.


Westwall may be exaggerating a bit but I wouldn't call him a liar.

YAD041 was a five sigma outlier that was given even more weight by Mann's haywire algorithms. It was responsible for a huge part of northern warming. Is it reasonable to use such a fluke measurement? Doubtful according to statistics.

In 2008, to back up the hockey stick, Mann used an upside-down lake sediment, with the same effect. Is it reasonable to use an incorrect proxy because it gives the desired result? Doubtful according to the scientific method.

Cherrypicked data and dodgy methodologies are the mainstay of climate science alarmism. It is shameful and possibly criminal in many instances. Mann should be banned.
 
Actually it was from a SINGLE tree in the entire grove. The rest of the grove showed nothing special.

Here's some discussions of the issue that debunk that brazen lie.

Yamal controversy - RationalWiki

Hey Ya! (mal)

Yes, that talks about actual science, hence the deniers here will all auto-scream it's a big fake.

The deniers here don't even try to discuss the science any more. No matter what the topic is, they just insta-scream that all the data is being faked by scary socialists. Every one of 'em is an ignorant cult troll, hellbent on their mission to shut down all rational discussion.

That's right, deniers. The whole planet is wrong, and only your tiny fringe political cult understands the RealTruth. I bet it makes you feel all tingly and important to believe that. You don't have to do anything except curse at your moral and intellectual betters, and you get proclaim how that makes you a superior human being. You get a huge emotional payoff for being lazy sociopaths. That kind of emotional lure must be irresistible to weak and immoral minds.


wholeplanet is wrong, and only your tiny fringe political cult understands the RealTruth.


You have that backwards we are not the narcissist, we don't claim to have the answers just question yours and your motives which you clearly admit.

.
 
Actually it was from a SINGLE tree in the entire grove. The rest of the grove showed nothing special.

Here's some discussions of the issue that debunk that brazen lie.

Yamal controversy - RationalWiki

Hey Ya! (mal)

Yes, that talks about actual science, hence the deniers here will all auto-scream it's a big fake.

The deniers here don't even try to discuss the science any more. No matter what the topic is, they just insta-scream that all the data is being faked by scary socialists. Every one of 'em is an ignorant cult troll, hellbent on their mission to shut down all rational discussion.

That's right, deniers. The whole planet is wrong, and only your tiny fringe political cult understands the RealTruth. I bet it makes you feel all tingly and important to believe that. You don't have to do anything except curse at your moral and intellectual betters, and you get proclaim how that makes you a superior human being. You get a huge emotional payoff for being lazy sociopaths. That kind of emotional lure must be irresistible to weak and immoral minds.


"tiny fringe political cult"................:2up:

Does anybody realize how University of Mars this statement is? This guy spends waaaaaaaaaaaaaaaaaaaaaaaaaay too much time in his apartment with the faggy cat!! You guys be the judge.........:coffee:........what the fuck is going on in that place people?

Pew poll from last year says only 28% of Americans think the scientists have this "consensus" thing right....:disbelief:....here....:disbelief:.....read it right here >> http://www.pewresearch.org/fact-tank/2016/12/05/many-americans-are-skeptical-about-scientific-research-on-climate-and-gm-foods/


So who really is the "tiny fringe political cult?!!!:deal:......:eusa_dance:..........:eusa_dance:..........:eusa_dance:..........:eusa_dance:.............:eusa_dance:..............:eusa_dance:
 
Actually it was from a SINGLE tree in the entire grove. The rest of the grove showed nothing special.

Here's some discussions of the issue that debunk that brazen lie.

Yamal controversy - RationalWiki

Hey Ya! (mal)

Yes, that talks about actual science, hence the deniers here will all auto-scream it's a big fake.

The deniers here don't even try to discuss the science any more. No matter what the topic is, they just insta-scream that all the data is being faked by scary socialists. Every one of 'em is an ignorant cult troll, hellbent on their mission to shut down all rational discussion.

That's right, deniers. The whole planet is wrong, and only your tiny fringe political cult understands the RealTruth. I bet it makes you feel all tingly and important to believe that. You don't have to do anything except curse at your moral and intellectual betters, and you get proclaim how that makes you a superior human being. You get a huge emotional payoff for being lazy sociopaths. That kind of emotional lure must be irresistible to weak and immoral minds.
"tiny fringe political cult".....

Does anybody realize how University of Mars this statement is? This guy spends waaaaaaaaaaaaaaaaaaaaaaaaaay too much time in his apartment with the faggy cat!! You guys be the judge..............what the fuck is going on in that place people?

Pew poll from last year says only 28% of Americans think the scientists have this "consensus" thing right..read it right here >> Many Americans are skeptical about scientific research on climate and GM foods
So who really is the "tiny fringe political cult?
You and the other denier cult cretins are, for sure, kooksucker!

Well of course everybody knows that we always settle important scientific issues with public opinion polls and ignore the scientific research.....LOLOLOLOLOL.....you are so crazy, kooksucker.

And a liar too, of course.

In the real world....

Global Warming Concern at Three-Decade High in US
GALLUP
MARCH 14, 2017
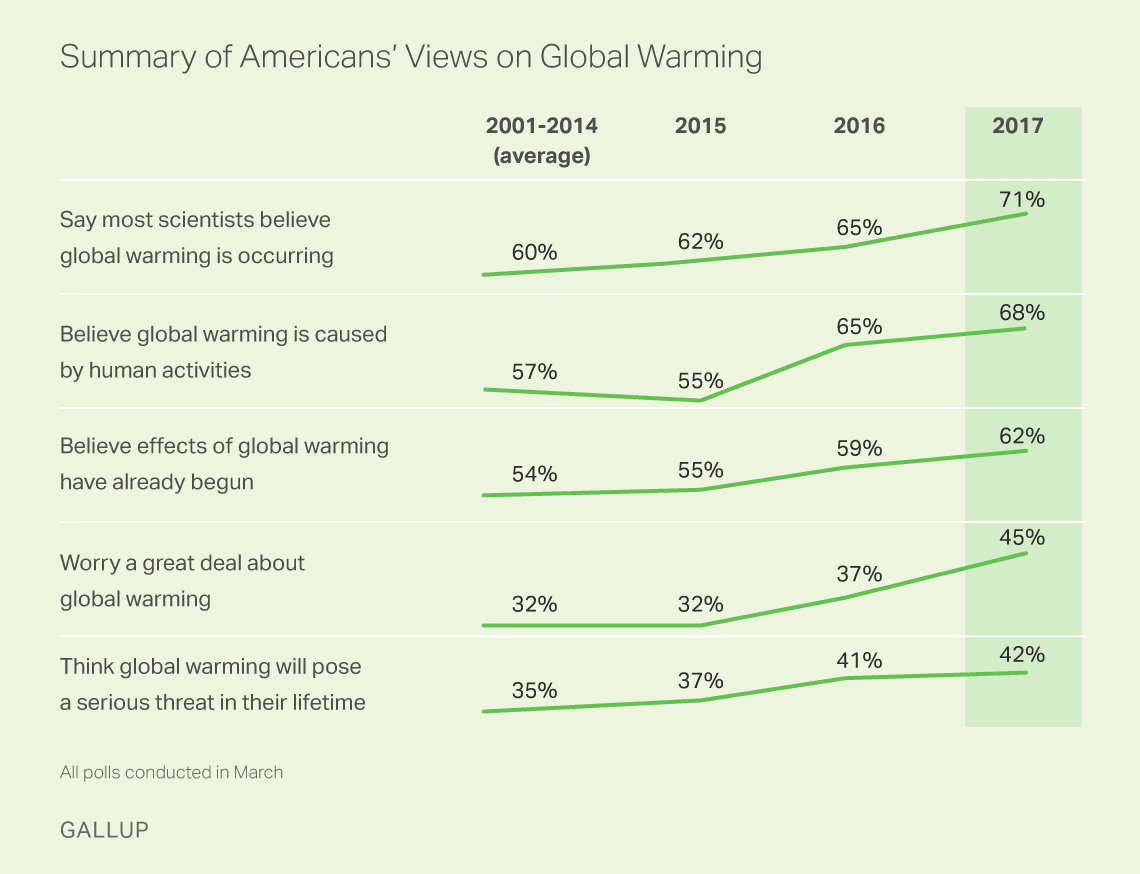
WASHINGTON, D.C. -- Record percentages of Americans are concerned about global warming, believe it is occurring, consider it a serious threat and say it is caused by human activity. All of these perceptions are up significantly from 2015.

ztze58ty2uupgzkw2v8fmw.png


Forty-five percent of Americans now say they worry "a great deal" about global warming, up from 37% a year ago and well above the recent low point of 25% in 2011. The previous high was 41%, recorded in 2007. Another 21% currently say they worry "a fair amount" about global warming, while 18% worry "only a little" and 16% worry "not at all."


What's funny is you trot these ridiculous polls out and after decades of relentless propaganda, and outright lying, the reality is the overwhelming majority of Americans simply don't believe a word you say, and they don't care about what you say because of it. Your polls are about as good as the ones that claimed the shrilary had a 97% chance of being our POTUS.
 

Forum List

Back
Top