So, Why all of the temp adjustments?

[/B]
If You knew anything about calculus then you`ld also know that there is no way that the temperature can be a linear proportional function of the CO2 IR absorption which is a non linear log function.
If You click on that:
Modtran Infrared Atmospheric Radiation Code

then run the model with CO2 starting @ 250 ppm then repeat to ~350 ppm or more and check the numeric output on the right side then You can see that the delta T increase the best ISDN computer model puts out is a LINEAR 0.1 per 10 ppm CO2 increase....

which is exactly the point "flacaltenn" was making.!!!

There's no delta T on the right side. Sorry, please explain.

Gee OopyDoo -- I thought you knew all this.. CO2 forcing function is in W/m2. You get to temperature only thru knowing properties of the medium that youre heating (like the Earth). But since you made fun of my vast investment in knowledge -- I'm not gonna share anymore with you... Who's a LOSER? You're a cute little LOSER... :tongue:

:cool:
 
[/B]
If You knew anything about calculus then you`ld also know that there is no way that the temperature can be a linear proportional function of the CO2 IR absorption which is a non linear log function.
If You click on that:
Modtran Infrared Atmospheric Radiation Code

then run the model with CO2 starting @ 250 ppm then repeat to ~350 ppm or more and check the numeric output on the right side then You can see that the delta T increase the best ISDN computer model puts out is a LINEAR 0.1 per 10 ppm CO2 increase....

which is exactly the point "flacaltenn" was making.!!!

There's no delta T on the right side. Sorry, please explain.

That`s a reasonable request,...Sure I`ll explain,because the delta T is not directly displayed by the Modtran. You have to obtain it Yourself by submitting ~ 10 different CO2 Modtran requests and then plot them as T versus ppm CO2.

Go to the Modtran, enter a value for CO2, click on the "submit calculation button", then on the right side Model Output window, You have to scroll all the way down to see it, there is a button "View the whole output file"
click on that and then You got the numeric data which is used to plot the graphs You have just seen in this window.
But to get the delta T values You have to do that Yourself and use the Modtran in 10 ppm increments. Then You can use Your favorite "spread sheet", enter in the cell where You want to see dT=T2-T1, copy it down that column and enter the Modtran numeric data output...You do know how to use a spreadsheet right?
Even though it`s still tedious to do all that....funny that they don`t offer a Modtran version that does that and just give You the numeric output..the only thing they are really generous with are graphs with a totally disproportional Y-axis factor to really make the point how T skyrockets with ppm CO2 on the X-axis.
Anyway I did that 2 years ago, then again last year and the Temp. increase was a constant step for each 10 ppm increment from 250 ppm all the way up to 500 ppm CO2...!!!
Maybe they finally "corrected" that,....these "re-adjustments" they do,...lately almost every week.
I got better things to do than running numbers through their stupid Modtran every day..You can save Yourself all that work and just look at ANY "global warming" degT versus ppm CO2 GRAPH they published...On every graph they published the T-curve runs parallel with the ppm CO2,...the temperature is DIRECTLY PROPORTIONAL to ppm CO2...and All proportional functions are LINEAR...!!!

Don`t tell me You did not know that.
By the way, if You do want to go through all that trouble then while You are at it take a look how wildly the Temps vary when You enter different atmospheric conditions. They don`t even bother themselves to do that for the data they publish....not even at the point where data is collected.
..ppm CO2 are "adjusted" for standard atm conditions right at Mauna Loa and every sampling point they have....Moisture, bar-pressure never even enters the equation already at that point...:
http://www.esrl.noaa.gov/gmd/ccgg/trends/
Monthly mean atmospheric carbon dioxide at Mauna Loa Observatory, Hawaii

The carbon dioxide data (red curve), measured as the mole fraction in dry air, on Mauna Loa constitute the longest record of direct measurements of CO2 in the atmosphere.
Data are reported as a dry mole fraction defined as the number of molecules of carbon dioxide divided by the number of molecules of dry air multiplied by one million (ppm).
And that`s the CO2 data used in EVERY COMPUTER MODEL...!!!
Of course, because if You use MOLAR ppm then the CO2 remains constant regardless of pressure...but if You do run an IR spectrophotometer that obeys Beer&Lambert`s absorption laws then it`s the absolute amount of CO2 per cubic meter air that matters...and that gets less and less with altitude.
The real cheat however is the "divided by the #of Mol.s DRY AIR"...not only because that already inflated the CO2 ppm by taking moisture out of the equation, but mostly because You can`t even claim while keeping a straight face that You could even measure an increase of 100 ppm CO2 in air at normal moisture with an infrared spectrophotometer!!! To do that You have to use GC (Gas Chromathography)....Like we did where I was:
scaled.php


You can see it front left, that`s a GC...and on that pic You can see another one on the left, smack center on the lab bench:
scaled.php


Inside is a column. You inject a precise amount of the sample gas and the gas components come out at different "rF" values. First the "rare" gasses in our atm, then Nitrogen & Oxygen, then the CO2 and after that whatever H2O was in the sample as "moisture". For a detector we used a "DTC" (differential thermal conductivity) and the whole thing is DEAD ACCURATE to a fraction of a ppm CO2....which is why the Diesel Power Plant we run nearby to keep us alive made a complete joke out of the entire exercise..!!
It was part of my job to calibrate these instruments for that climate clown who was actually running the samples...he studied some Social Science crap...and that`s typical! When I came to Canada I worked first in the FDA, doing trace analysis,...meaning a shitload of IR and Atomic Absorption spectral analysis..then in the main RCMP forensic Lab when it was still in Winnipeg...got bored and joined the Military Engineers and landed in the Arctic.
In all these years I have never ever seen a real Chemist in any of these labs up in the arctic, and I bet at Mauna Loa it ain`t any different.
 
Last edited:
[/B]
If You knew anything about calculus then you`ld also know that there is no way that the temperature can be a linear proportional function of the CO2 IR absorption which is a non linear log function.
If You click on that:
Modtran Infrared Atmospheric Radiation Code

then run the model with CO2 starting @ 250 ppm then repeat to ~350 ppm or more and check the numeric output on the right side then You can see that the delta T increase the best ISDN computer model puts out is a LINEAR 0.1 per 10 ppm CO2 increase....

which is exactly the point "flacaltenn" was making.!!!

There's no delta T on the right side. Sorry, please explain.

Gee OopyDoo -- I thought you knew all this.. CO2 forcing function is in W/m2.

Yeah. Exactly. Its not a delta T like polarbear claimed. That's my point, ya fuckin' idiot.
 
[/B]
If You knew anything about calculus then you`ld also know that there is no way that the temperature can be a linear proportional function of the CO2 IR absorption which is a non linear log function.
If You click on that:
Modtran Infrared Atmospheric Radiation Code

then run the model with CO2 starting @ 250 ppm then repeat to ~350 ppm or more and check the numeric output on the right side then You can see that the delta T increase the best ISDN computer model puts out is a LINEAR 0.1 per 10 ppm CO2 increase....

which is exactly the point "flacaltenn" was making.!!!

There's no delta T on the right side. Sorry, please explain.

That`s a reasonable request,...Sure I`ll explain,because the delta T is not directly displayed by the Modtran. You have to obtain it Yourself by submitting ~ 10 different CO2 Modtran requests and then plot them as T versus ppm CO2.

Go to the Modtran, enter a value for CO2, click on the "submit calculation button", then on the right side Model Output window, You have to scroll all the way down to see it, there is a button "View the whole output file"
click on that and then You got the numeric data which is used to plot the graphs You have just seen in this window.
But to get the delta T values You have to do that Yourself and use the Modtran in 10 ppm increments. Then You can use Your favorite "spread sheet", enter in the cell where You want to see dT=T2-T1, copy it down that column and enter the Modtran numeric data output...You do know how to use a spreadsheet right?
Even though it`s still tedious to do all that....funny that they don`t offer a Modtran version that does that and just give You the numeric output..the only thing they are really generous with are graphs with a totally disproportional Y-axis factor to really make the point how T skyrockets with ppm CO2 on the X-axis.
Anyway I did that 2 years ago, then again last year and the Temp. increase was a constant step for each 10 ppm increment from 250 ppm all the way up to 500 ppm CO2...!!!
Maybe they finally "corrected" that,....these "re-adjustments" they do,...lately almost every week.

Sorry but I'm unable to replicate your results. The 'T' column doesn't change when I change the ppm of Co2. It would appear the T profile of the atmosphere is assumed.

Modtran is an Air Force code. I'm sure its accurate. It models the path a beam of radiation will take through the atmosphere, not global warming.


I got better things to do than running numbers through their stupid Modtran every day..You can save Yourself all that work and just look at ANY "global warming" degT versus ppm CO2 GRAPH they published...On every graph they published the T-curve runs parallel with the ppm CO2,...the temperature is DIRECTLY PROPORTIONAL to ppm CO2...and All proportional functions are LINEAR...!!!

Don`t tell me You did not know that.
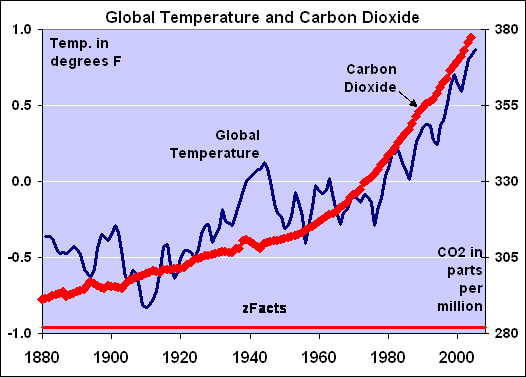
You mean this?

zFacts-CO2-Temp.gif


?

That really happened
Sorry reality doesn't correspond with your understanding of it. Have you ever considered the possibility that non-linear relationships appear linear over a small enough range? Without that fact perturbation analysis wouldn't be possible.
 
Modtran is an Air Force code. I'm sure its accurate. It models the path a beam of radiation will take through the atmosphere, not global warming.


You mean this?

zFacts-CO2-Temp.gif


?

That really happened
Sorry reality doesn't correspond with your understanding of it. Have you ever considered the possibility that non-linear relationships appear linear over a small enough range? Without that fact perturbation analysis wouldn't be possible.

What the f..K are You clicking on? All You have to do is what I told You before...and then You get the ppm CO2 input===> T (in Kelvin) + Watts/m^2 and everything else exploded in a numerical format on the right side after You click on the button @ the lower right ! Go do it for 10 different CO2 ppm and make a spreadsheet !
You mean this?
No You meant this...! You picked it !!.. And even with this graph You should have noticed that the CO2 & T "anomaly" runs parallel...shit it even overlaps !


Sorry reality doesn't correspond with your understanding of it. Have you ever considered the possibility that non-linear relationships appear linear over a small enough range?
So in your milk maid math, delta y from y=1 to y=3 where y=x^2/n which is a non-linear function but "appears" to you as linear if n is large enough, You figure I would be as dumb as the people for like You do ?.. who get sucked in by the "climate science" visual illusions...these idiotic Model Translators (Modtrans) graphs
for public consumption Oh I forgot, Modtran is "Airforce code"...so please do tell me then what Fortran is.
>>>>>>>>>>>>>>>>>>>>>>
I decided to come back here to make the whole thing real simple for You:
Here is a web page most of these CO2/ Temp graph freaks congregate to "adjust" their graph scripts in order to slam all the "deniers" in this case it was a Senator of the Aussie Gov :
http://chartsgraphs.files.wordpress.com/2009/08/co2_temp_scatter_regression.png?w=500&h=499
co2_temp_scatter_regression.png

I have color coded the data to distinguish the Law Dome and Mauna Loa CO2 observations as well as Senator Fielding’s study period (1995-2009). My plot includes the regression relationship which shows that temperature anomaly has increased 0.0092 C for each 1 ppmv increase in CO2.
So are You saying that a CONSTANT delta T of 0.0092 for each 1 ppm CO2 is not a linear function?
By the way if You take the trouble and do the Math with the Modtran3 output You get almost the same LINEAR INCREASE...it comes out @ a delta T = 0.01 per ppm CO2..!
>>>>>>>>>>>>>>>>> end of edit>>>>have a nice day!>>>>>


No wonder Liberal governments which blow $billion$ of taxe$ on "green" crap can still get tons idiots to vote for them that have a problem with exponential math functions:

[ame="http://www.youtube.com/watch?v=F-QA2rkpBSY"]The Most IMPORTANT Video You'll Ever See (part 1 of 8) - YouTube[/ame]


I guess in all fairness I should tell You that I supplied info for the Sun News Network (and still do) + a few Conservative Members of Parliament concerning the crap that went on in the "Astro Lab"...and just a little while ago our Finance Minister pulled the plug on all that "Climate science" crap that was on Ellesmere Island...so I really don`t care who listens to You or me in this forum...It`s to live in a country where elected MP`s actually read and respond to the e-mails of their citizens...I should copy&paste a few of the e-mails I got from them into this thread...it might just ruin Your day completely!

I`m fed up trying to fix HTML tags that appear for no good reason : "Green&quot instead of a " ...if there are still a few up there I don`t care
Good Night
 
Last edited:
What the f..K are You clicking on? All You have to do is what I told You before...and then You get the ppm CO2 input===> T (in Kelvin) + Watts/m^2 and everything else exploded in a numerical format on the right side after You click on the button @ the lower right ! Go do it for 10 different CO2 ppm and make a spreadsheet !

On the web page, T doesn't change when CO2 ppm changes. Modtran isn't calculating T, it calculates the path of light.


No You meant this...! You picked it !!.. And even with this graph You should have noticed that the CO2 & T "anomaly" runs parallel...shit it even overlaps !


So in your milk maid math, delta y from y=1 to y=3 where y=x^2/n which is a non-linear function but "appears" to you as linear if n is large enough, You figure I would be as dumb as the people for like You do ?
Non-linear functions are approximately linear over a small enough domain. Plot y = x^2 on any graphing calculator, then zoom in on any point of the curve you wish. If you zoom close enough, the curve appears linear.

Every heard of Taylor series? The first order taylor series is just that
f(x) approximately equals f(x0) + (x-x0)*f'(x0) in the neighborhood of x0.

For example, f(x) = x^2 has the taylor expansion f(x0) = x0^2 + 2.0*(x-x0)*x0. You can verify that the error of this expansion is (x-x0)^2
.. who get sucked in by the "climate science" visual illusions...these idiotic Model Translators (Modtrans) graphs
for public consumption Oh I forgot, Modtran is "Airforce code"...so please do tell me then what Fortran is.
You want to know what FORTRAN is? Try google.
 
Last edited:
On the web page, T doesn't change when CO2 ppm changes. Modtran isn't calculating T, it calculates the path of light.


Non-linear functions are approximately linear over a small enough domain. Plot y = x^2 on any graphing calculator, then zoom in on any point of the curve you wish. If you zoom close enough, the curve appears linear.

Every heard of Taylor series? The first order taylor series is just that
f(x) approximately equals f(x0) + (x-x0)*f'(x0) in the neighborhood of x0.

For example, f(x) = x^2 has the taylor expansion f(x0) = x0^2 + 2.0*(x-x0)*x0. You can verify that the error of this expansion is (x-x0)^2

You want to know what FORTRAN is? Try google.

Gee Whiz -- that's deep.. Wait let me absorb that.. I've been overdoing my polynomial fits for YEARS I guess.

I think OOpyDoo just hit on the cause of the psychotic hysteria that afflicts Hansen and the other cheerleaders.. THey've been looking at a 2% increase in the Global Mean Temp for YEARS on a graph that it is SIZED to a 4% dependent variable change. Looking at it that way and having this burned into your retina CAN AND WILL induce hysteria. Especially when you try to divine the higher order fits to this blip on that kind of scale. THEY should stick to linear approximations eh???

I'm sorry if the graphs of actual Co2 content and measured temperature don't have the shape you'd prefer.
 
On the web page, T doesn't change when CO2 ppm changes. Modtran isn't calculating T, it calculates the path of light.


Non-linear functions are approximately linear over a small enough domain. Plot y = x^2 on any graphing calculator, then zoom in on any point of the curve you wish. If you zoom close enough, the curve appears linear.

Every heard of Taylor series? The first order taylor series is just that
f(x) approximately equals f(x0) + (x-x0)*f'(x0) in the neighborhood of x0.

For example, f(x) = x^2 has the taylor expansion f(x0) = x0^2 + 2.0*(x-x0)*x0. You can verify that the error of this expansion is (x-x0)^2

You want to know what FORTRAN is? Try google.

Just why the F..k do You think You can impress anybody with "ever heard of the first order Taylor series"....after You Googled and looked it up at Wikipedia...f(x) ~ f(x0) + (x-x0)*f'(x0) if x~0
For example, f(x) = x^2 has the taylor expansion f(x0) = x0^2 + 2.0*(x-x0)*x0.
"The error of expansion"....there is no error with the INCREASE ..regardless how far away you go from x0...!!!
The increase per step (x) will always be 2x if f(x)= x^2....!!!
You haven`t even got a clue what they were talking about who ever You were quoting.
]For example, f(x) = x^2 has the taylor expansion f(x0) = x0^2 + 2.0*(x-x0)*x0.
Y=f(x)=x^2
The increase per step d =
((x+d)^2 -x^2)/d=
(x^2 + 2dx - x^2)/ d = 2dx/d = (the INCREASE)=2x which is the differential for the function f(x^2) and it does not matter how "far away" x is from "x0".
Any high school kid knows that...but You did not !
So what we have here is an exponential function where the first differential is a linear function.!!!
So tell me how the the CO2 absorption of IR which is an exponential log function could possibly be in a direct linear relationship with the Temperature..!!!!
Why are You blowing all this smoke...?
You are the one who keeps insisting that an increase of CO2 causes an increase in temperature...!...not me !
Stick to the subject...instead of blabbering about "have you ever heard about the Taylor series"...for f(x)= x^2 show me what the function for the Temperature increase per ppm CO2 is..

 
Last edited:
avatar29864_1.gif
You want to know what FORTRAN is? Try google


I`m not one of your primitive "soul brothers" which only recently climbed down from the trees....."bro"..!!! I wrote in Fortran long before You were born...and don`t have to google for it like you.
When I go "Googling" I look for more interesting stuff.., it`s by far more amusing to look at who filed what for income tax in the IRS files...or which "charities" make how much money...instead of clicking on your stupid Googled links
- Google Search

Some day I`ll find Michael Mann`s and Hansen`s in there while you Liberal assholes want to see Romney`s
 
Last edited:

Forum List

Back
Top