RSS shows NO RECORDS set in 2014

Billy_Bob

Diamond Member
Sep 4, 2014
30,837
20,604
1,945
Top Of The Great Divide
offset-0-3124.png


Well, Well, Well....

RSS shows that the Historical Climate Network and NOAA have some serious issues. There are no records that have been set. No Hottest anything..

It shows that the value on November 30 is about 0.18 C below the average of 0.33 for November. I have no idea what has happened since and I realize this applies to version 5.6 only, however due to the way the numbers can vary month to month, I can not rule out that UAH version 5.5 may not end up as low as ninth or tenth.

Another Alarmist myth bites the dust! I wonder how NASA and NOAA are going to rectify their blatant temperature manipulations?

Source
 
Well, since NOAA and NASA are just two of the agencies worldwide that keep and interpret this kind of data, why don't we see where the other agencies come in at.,

2014 on course to be one of hottest possibly hottest on record

2014 on course to be one of hottest, possibly hottest, on record

Exceptional heat and flooding in many parts of the world


Lima/Geneva, 3 December 2014 (WMO) - The year 2014 is on track to be one of the hottest, if not the hottest, on record, according to preliminary estimates by the World Meteorological Organization (WMO). This is largely due to record high global sea surface temperatures, which will very likely remain above normal until the end of the year. High sea temperatures, together with other factors, contributed to exceptionally heavy rainfall and floods in many countries and extreme drought in others.

WMO’s provisional statement on the Status of the Global Climate in 2014 indicated that the global average air temperature over land and sea surface for January to October was about 0.57° Centigrade (1.03 Fahrenheit) above the average of 14.00°C (57.2 °F) for the 1961-1990 reference period, and 0.09°C (0.16 °F) above the average for the past ten years (2004-2013).

If November and December maintain the same tendency, then 2014 will likely be the hottest on record, ahead of 2010, 2005 and 1998. This confirms the underlying long-term warming trend. It is important to note that differences in the rankings of the warmest years are a matter of only a few hundredths of a degree, and that different data sets show slightly different rankings.

The high January to October temperatures occurred in the absence of a full El Niño-Southern Oscillation (ENSO). ENSO occurs when warmer than average sea-surface temperatures in the eastern tropical Pacific combine, in a self-reinforcing loop, with atmospheric pressure systems, thus affecting weather patterns globally. During the year, sea surface temperatures increased nearly to El Niño thresholds but this was not coupled with an atmospheric response. However, many weather and climate patterns normally associated with El Niño/Southern Oscillation (ENSO) were observed in many parts of the world.
 
And the English

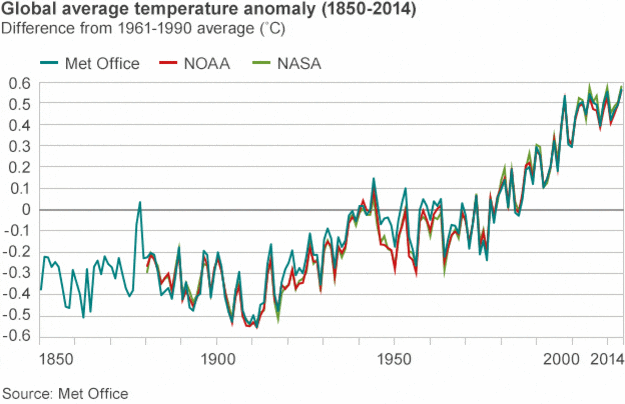
BBC News - World on course for warmest year
http://www.bbc.com/news/science-environment-30311816#ns-panel__section-6
  • ×

    _79420539_temperature_anomaly_624_nopointers.gif
  • 1878: Strong El Nino
    ×
    In 1878, there was a strong El Nino (where warmer water rises to the surface of the Eastern Pacific Ocean) and this is seen very clearly as a large spike in global temperature. This event was remarkable for an extreme drought in India where it is an estimated more than five million people died. There were droughts in nothern China also associated with this El Nino. The famine caused by the drought in India spurred scientists to begin work on climate patterns, leading eventually to discovery of the El Nino-related “Southern Oscillation” - the idea that the ocean and atmosphere are connected.
  • [paste:font size="5"]1940s: Weaker El Nino
    ×[/paste:font]
    The warm early 1940s were affected by a weaker, but protracted, El Nino.

  • 1991: Mt Pinatubo eruption
    ×
    In June 1991 Mt Pinatubo in the Philippines erupted, releasing millions of tons of sulphur dioxide into the atmosphere. This resulted in a decrease in the temperature worldwide.
  • [paste:font size="5"]1998: Record-breaking year
    ×[/paste:font]
    For a long time. the strong El Nino around 1997/98 meant that 1998 topped the rankings for the world’s warmest year. This has since been overtaken.

  • 1960/70s: Cooler years
    ×
    The cool 1960s and 1970s are likely to have resulted at least partly from man-made air pollution from sulphate particles. Steps taken towards cleaner air resulted in warming.

In comments released with the new figures, he said:

"The provisional information for 2014 means that 14 of the 15 warmest years on record have occured in the 21st century.
 
And the English

BBC News - World on course for warmest year
  • ×

    _79420539_temperature_anomaly_624_nopointers.gif
  • 1878: Strong El Nino
    ×
    In 1878, there was a strong El Nino (where warmer water rises to the surface of the Eastern Pacific Ocean) and this is seen very clearly as a large spike in global temperature. This event was remarkable for an extreme drought in India where it is an estimated more than five million people died. There were droughts in nothern China also associated with this El Nino. The famine caused by the drought in India spurred scientists to begin work on climate patterns, leading eventually to discovery of the El Nino-related “Southern Oscillation” - the idea that the ocean and atmosphere are connected.
  • [paste:font size="5"]1940s: Weaker El Nino
    ×[/paste:font]
    The warm early 1940s were affected by a weaker, but protracted, El Nino.

  • 1991: Mt Pinatubo eruption
    ×
    In June 1991 Mt Pinatubo in the Philippines erupted, releasing millions of tons of sulphur dioxide into the atmosphere. This resulted in a decrease in the temperature worldwide.
  • [paste:font size="5"]1998: Record-breaking year
    ×[/paste:font]
    For a long time. the strong El Nino around 1997/98 meant that 1998 topped the rankings for the world’s warmest year. This has since been overtaken.

  • 1960/70s: Cooler years
    ×
    The cool 1960s and 1970s are likely to have resulted at least partly from man-made air pollution from sulphate particles. Steps taken towards cleaner air resulted in warming.

In comments released with the new figures, he said:

"The provisional information for 2014 means that 14 of the 15 warmest years on record have occured in the 21st century.

And the facts dispute his adjusted world view..
 
Even those attending the AGU Meeting show divergence problems with models and reality in temps that are falling fast....

ipcc-models-vs-observations-cato.png


"Introduction:

Recent climate change literature has been dominated by studies which show that the equilibrium climate sensitivity is better constrained than the latest estimates from the Intergovernmental Panel on Climate Change (IPCC) and the U.S. National Climate Assessment (NCA) and that the best estimate of the climate sensitivity is considerably lower than the climate model ensemble average.

From the recent literature, the central estimate of the equilibrium climate sensitivity is ~2°C, while the climate model average is ~3.2°C, or an equilibrium climate sensitivity that is some 40% lower than the model average."

Another Score by Anthony Watts.... Simply stunning that they know the scam is a fraud and yet they still tout it as truth...

Source WUWT
 
RSS has been an outlier the past 4 or 5 years. This satellite dataset doesn't make any sense when compared against uah and surface data.

But its right on the money with USCRN.. so who are really the outliers?

USCRN and RSS say the rest of the mess, that the folks have been manipulating, is off and you want to run with the adjusted crap...:bang3:
 
Last edited:
I the factual temperature record from satellites and Old Crock posts alarmist drivel. Never once addressing the 'serious issues" that NOAA and NASA have with the records they keep adjusting upwards..

1) You provided no source for the data you posted
2) The data you posted said absolutely NOTHING about any manipulation of data
 
From Wikipedia, Satellite temperature measurements

Christy et al. (2007) find that the tropical temperature trends from radiosondes matches closest with his v5.2 UAH dataset.[22] Furthermore, they assert there is a growing discrepancy between RSS and sonde trends beginning in 1992, when the NOAA-12 satellite was launched. This research found that the tropics were warming, from the balloon data, +0.09 (corrected to UAH) or +0.12 (corrected to RSS) or 0.05 K (from UAH MSU; ±0.07 K room for error) a decade.

These numbers would indicate that the RSS system is currently giving values 0.264C low according to John Christy, a champion among deniers.

But feel free to tell us that it needs to be adjusted upwards to maintain its accuracy.
 
Last edited:
so a 'champion among deniers' is willing to state that he thinks one of the global datasets is too low. are there any 'champions among warmistas' that are willing to state that any of the global datasets are too high?
 
Adjustments have been made in both directions by all the major climatological organizations.
 
I'll give you a thought, though. I'll bet you that there are a lot more process details that would cause a low reading (less heat transfer to the instrument) than would cause a high one. Once you get the thermal energy into the instrument, errors would likely be random and therefore, lacking bias. But the process of heat transfer is easily interfered with and such interference will always cause less heat than intended to make the transfer.

Mind you, that's just a thought. I can already see problems with the idea (ex darkening by corrosion, UHI, etc).
 
I the factual temperature record from satellites and Old Crock posts alarmist drivel. Never once addressing the 'serious issues" that NOAA and NASA have with the records they keep adjusting upwards..

1) You provided no source for the data you posted
2) The data you posted said absolutely NOTHING about any manipulation of data

What a farce you guys are. This is from the wood for trees graphing and the data is clearly notated along with the mean and number of months averaged.

I plotted two that should have been very close but oddly there is a non-logical divergence of the data sets. WHAT CAUSED IT? RSS has been checked and calibrations verified.. HCN (Gis) is the set they are manipulating buy their own admission.

You inability to read and understand graphing is very telling.
 
LOL..

NOAA and their 'hottest' claims have been quietly pulled from their web site..

Gee, ol' Billy Boob, can you not post anything that is not a lie?

State of the Climate National Climatic Data Center NCDC

Global Summary Information - November 2014
See Full Report

November 2014 global temperature ties for seventh highest on record;
Year-to-date global temperature highest on record

Old Crock posts the ADJUSTED data again touting it as truth..
You really are a paid for shill with blinders on.
 

Forum List

Back
Top