Navigation
Install the app
How to install the app on iOS
Follow along with the video below to see how to install our site as a web app on your home screen.

Note: This feature currently requires accessing the site using the built-in Safari browser.
More options
You are using an out of date browser. It may not display this or other websites correctly.
You should upgrade or use an alternative browser.
You should upgrade or use an alternative browser.
Arctic ice trends
- Thread starter Crick
- Start date

Old Rocks
Diamond Member
- 2014 AGU Fall Meeting
- C11D-03CryoSat-2 observes Arctic sea ice volume recovery, after anomalously low melting in summer 2013
Pa
Monday, December 15, 201408:30 AM - 08:45 AM- Moscone West
- 3007
Polar Science Center PIOMAS Arctic Sea Ice Volume Reanalysis

Fig.1 Arctic sea ice volume anomaly from PIOMAS updated once a month. Daily Sea Ice volume anomalies for each day are computed relative to the 1979 to 2011 average for that day of the year. Tickmarks on time axis refer to 1st day of year. The trend for the period 1979- present is shown in blue. Shaded areas show one and two standard deviations from the trend. Error bars indicate the uncertainty of the monthly anomaly plotted once per year.
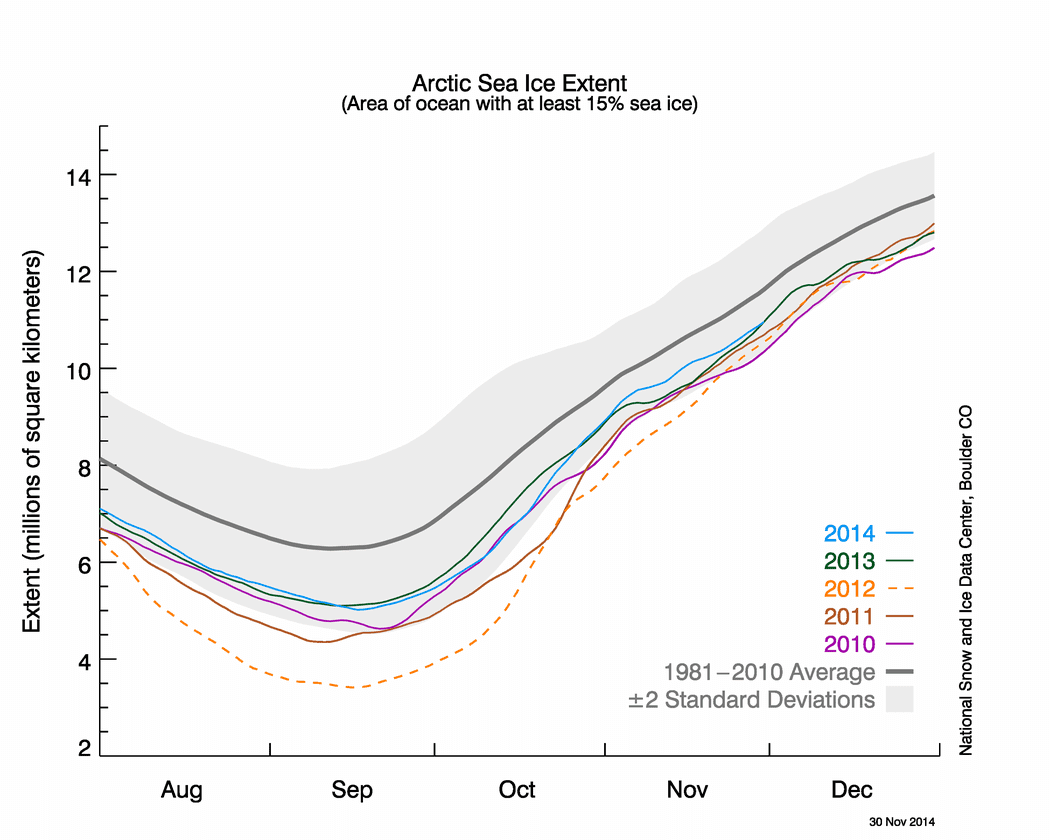
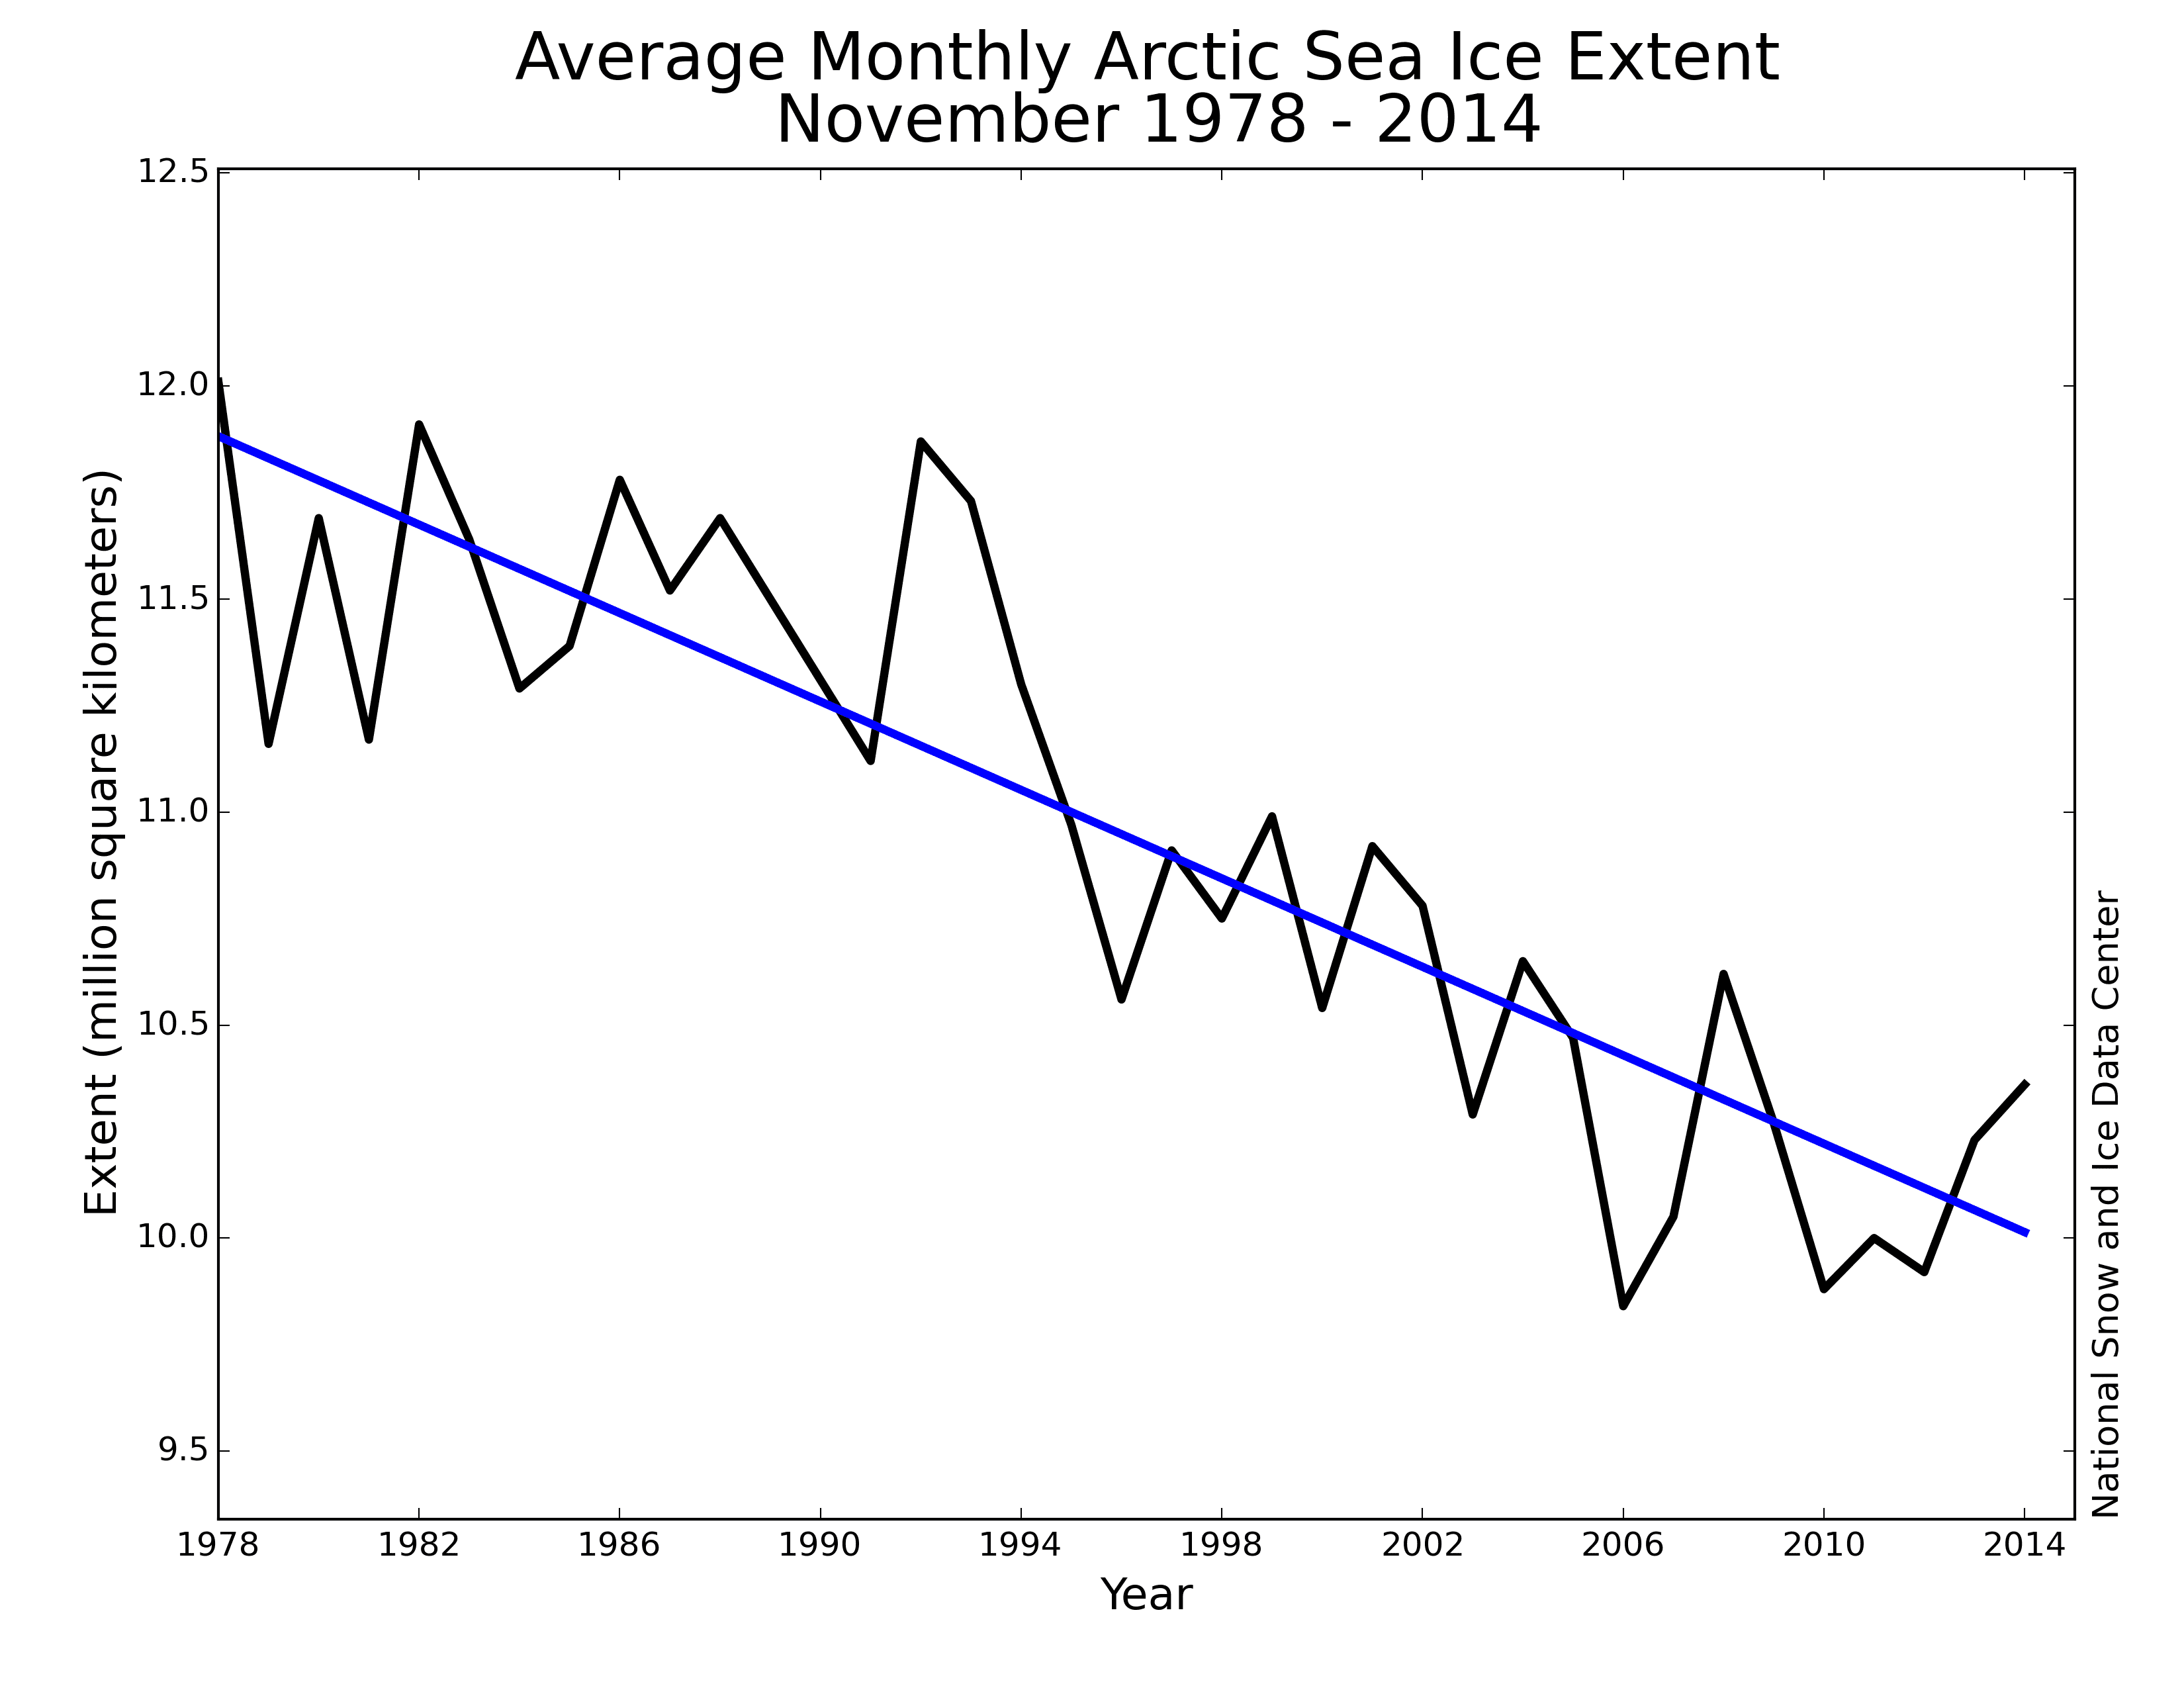
Yes, the volume has increased in the last two years. However, if you look at the chart from the University of Washington, you can see that the present upward increase is hardly the largest such increase on record, and, in ensuing years, the downward trend continued.
Billy_Bob
Diamond Member
I think Mr Steel has much better grasp on what is really going on..
Billy_Bob
Diamond Member
Ice loss has stabilized and the Ocean temps have dropped. Its now just a matter of a year or two before major ice rebound occurs, Maybe even this year as several flows have decreased and the temp along with them.
lets face it......the alarmist view on sea ice has long since been dismissed by most people..........they heard all of the nutty-ass predictions 15.........20 years ago, all of which fell flat on their face.
Old Rocks
Diamond Member
What a liar you are, Billy Boob;Ice loss has stabilized and the Ocean temps have dropped. Its now just a matter of a year or two before major ice rebound occurs, Maybe even this year as several flows have decreased and the temp along with them.
Global Sea Surface Temperature Anomalies El Nino Southern Oscillation ENSO Teleconnections National Climatic Data Center NCDC
Old Rocks
Diamond Member
I think Mr Steel has much better grasp on what is really going on..
And what are Mr. Steel's credentials, other than a mud slinging fool.
Old Rocks
Diamond Member
Real scientists on the Arctic issues.
Old Rocks
Diamond Member
Seeing.
Old Rocks
Diamond Member
More information from the current meeting. Hey Walleyes, where the hell is your presentation?
Old Rocks
Diamond Member
Wonderful question and answer period on this video, with the authors of the original articles on the issues.
- May 20, 2009
- 144,170
- 66,454
- 2,330
Arctic Weather Map
4 cardinal point today
Barrow -2F
Alert -20F
Vize -6F
Kotel -26F
What the melting temperature of ice?
4 cardinal point today
Barrow -2F
Alert -20F
Vize -6F
Kotel -26F
What the melting temperature of ice?
What is it around here? Was it "Arctic Week" on the Discovery Channel?
- Dec 18, 2013
- 136,275
- 27,868
- 2,180
lava lamp?I love pretty charts...

I love pretty charts...
Lol.....so ghey. Very colorful though!
The only relevant news about the Arctic today.....
Russia says will build up Arctic military presence
Top story on DRUDGE!
Nothing else on the arctic in months!

SSDD
Gold Member
- Nov 6, 2012
- 16,672
- 1,966
- 280
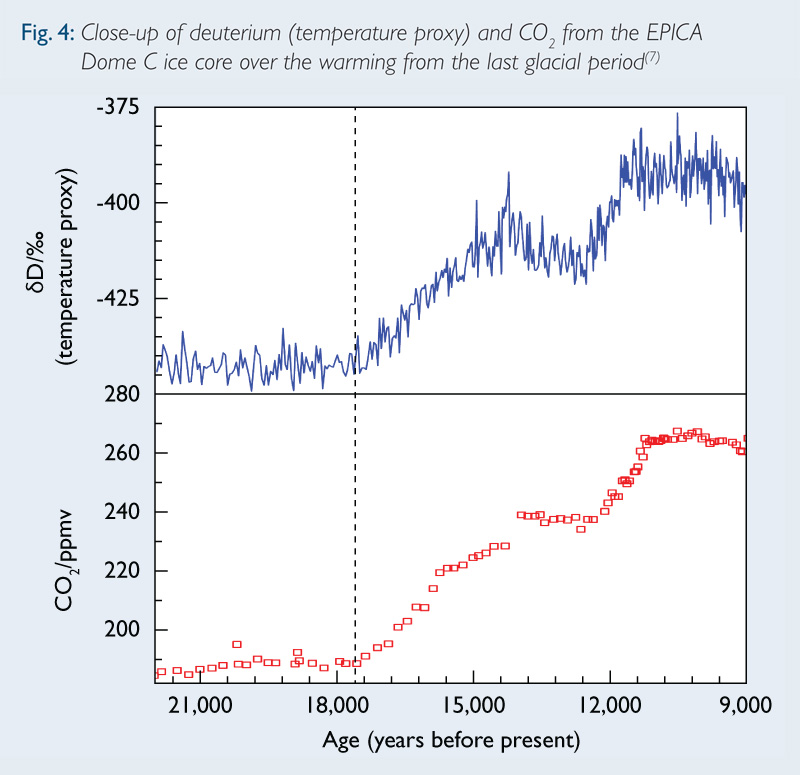
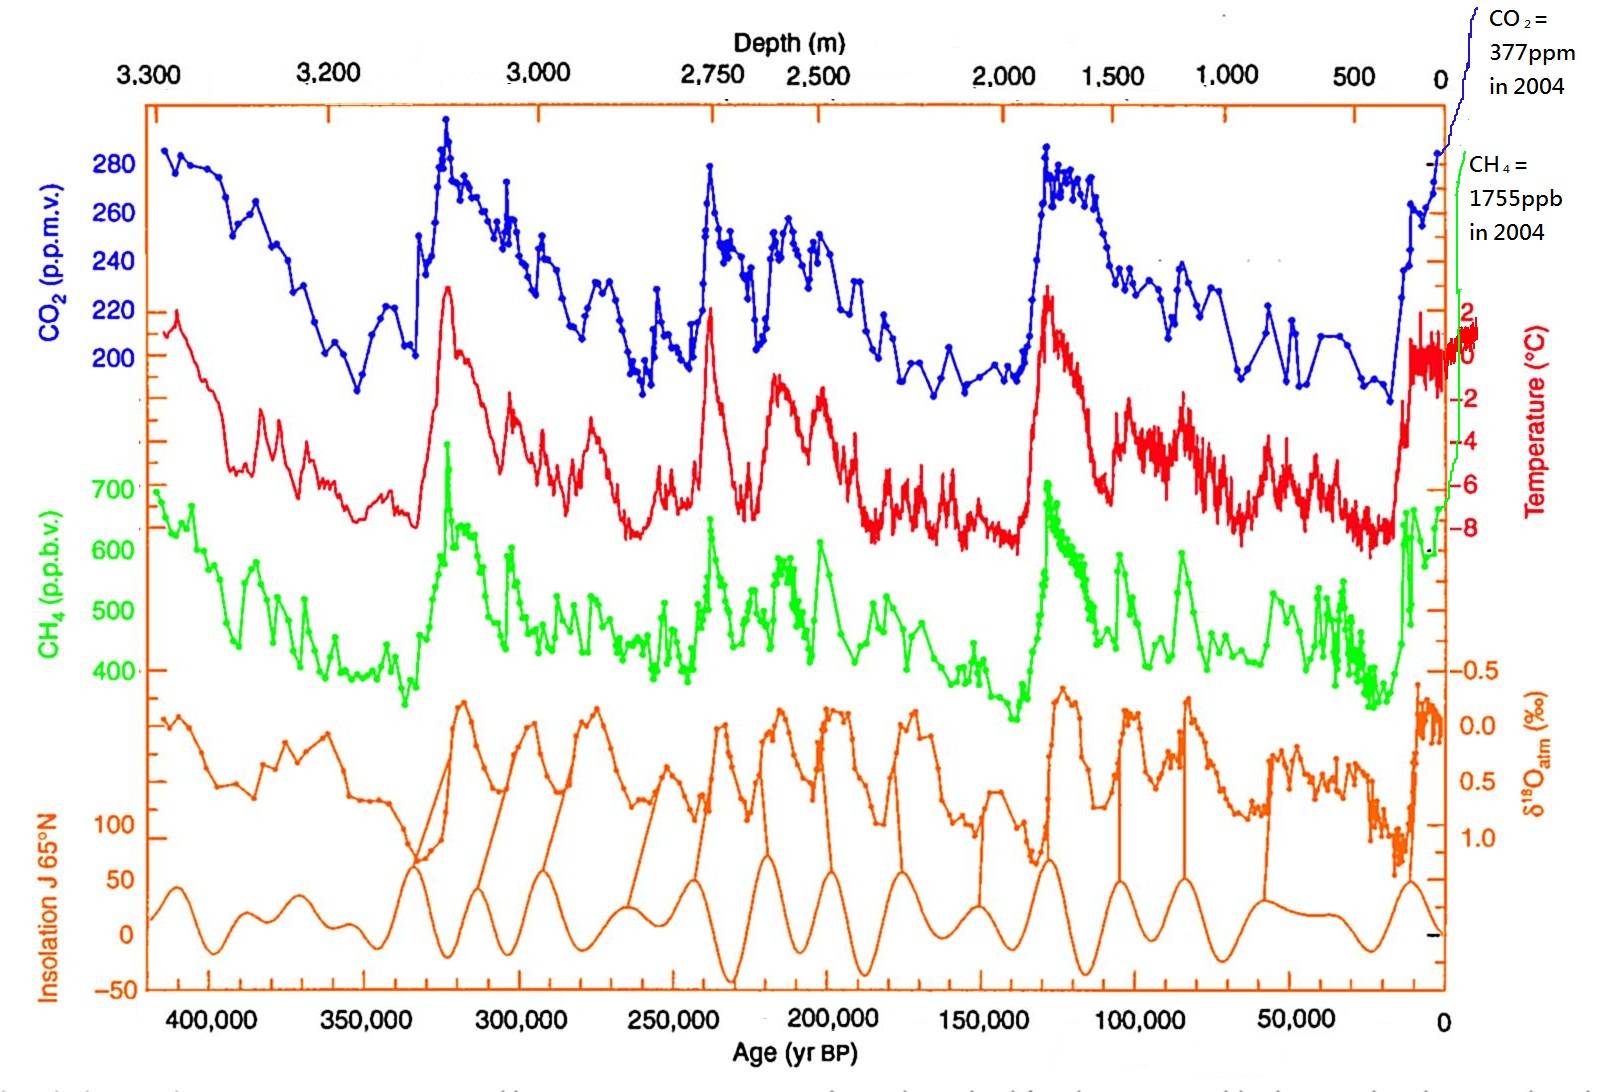
Real scientists on the Arctic issues.
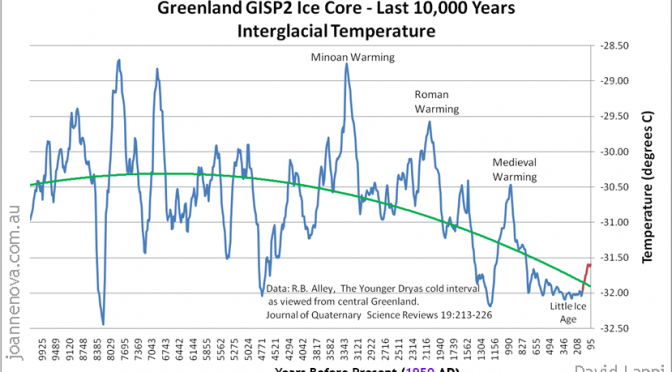
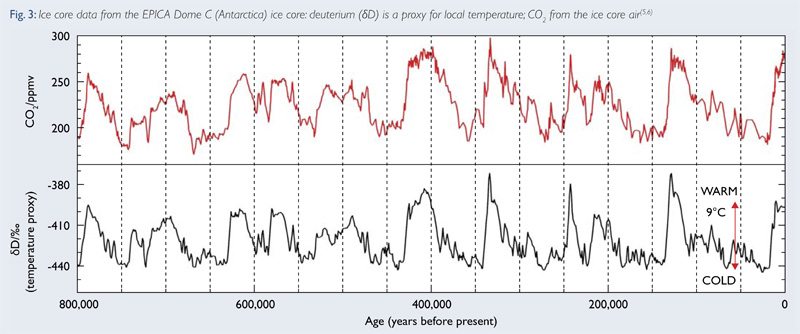
Here is some real science on arctic issues...So according to real science, how does the arctic look now, compared to most of the past 10,000 years. What you are pushing isn't real science..it is pseudoscientific cherry picking designed to support an alarmist narrative. Real science is about finding the truth..you aren't interested in that or you would be looking at the long term picture rather than a cherry picked snapshot of time which is the only thing that will support the alarmist narrative.


- May 20, 2009
- 144,170
- 66,454
- 2,330
Arctic Weather Map
4 cardinal point today
Barrow -4F
Alert -24F
Vize -8F
Kotel -22F
Brown shoes don't make it
4 cardinal point today
Barrow -4F
Alert -24F
Vize -8F
Kotel -22F
Brown shoes don't make it
Similar threads
- Replies
- 37
- Views
- 638
- Replies
- 28
- Views
- 535
- Replies
- 40
- Views
- 886
Latest Discussions
- Replies
- 2
- Views
- 8
- Replies
- 11
- Views
- 68
Forum List
-
-
-
-
-
Political Satire 8029
-
-
-
-
-
-
-
-
-
-
-
-
-
-
-
-
-
-
-
ObamaCare 781
-
-
-
-
-
-
-
-
-
-
-
Member Usernotes 468
-
-
-
-
-
-
-
-
-
-