- Apr 12, 2011
- 3,814
- 758
- 130
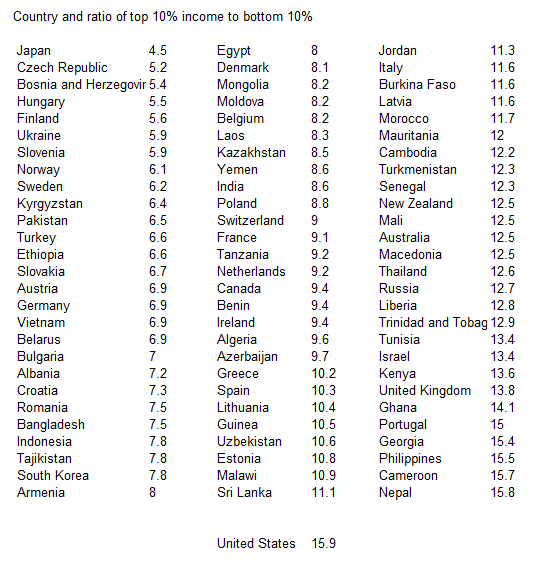
No it isn't. Lot's of empty talk here but any income gap is caused by the fact that some work more hours, get more education, and stay on the job longer than others. We're seeing a cultural divide that's increasing....The income gap is widening because of inflation and taxes...
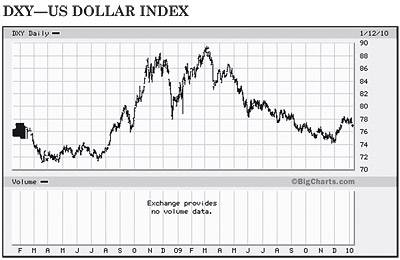
Actually, no. Foreign currencies have been devaluing more than the dollar and US inflation's been a no-show.The US Dollar is worth less...