- Banned
- #1
The AGW scam says that man has been the main factor in the planet getting hotter.
Today it was 100 F in Tallahassee Florida. Proof right?
Nope, not even close. The last time it was 100 F on this day was 80 years ago.
Not only that but the city of Tallahassee in a much bigger heat sink now than it was 80 years ago with a lot more construction and concrete going on nowadays.
So no warmer than 80 years ago, check

 www.wctv.tv
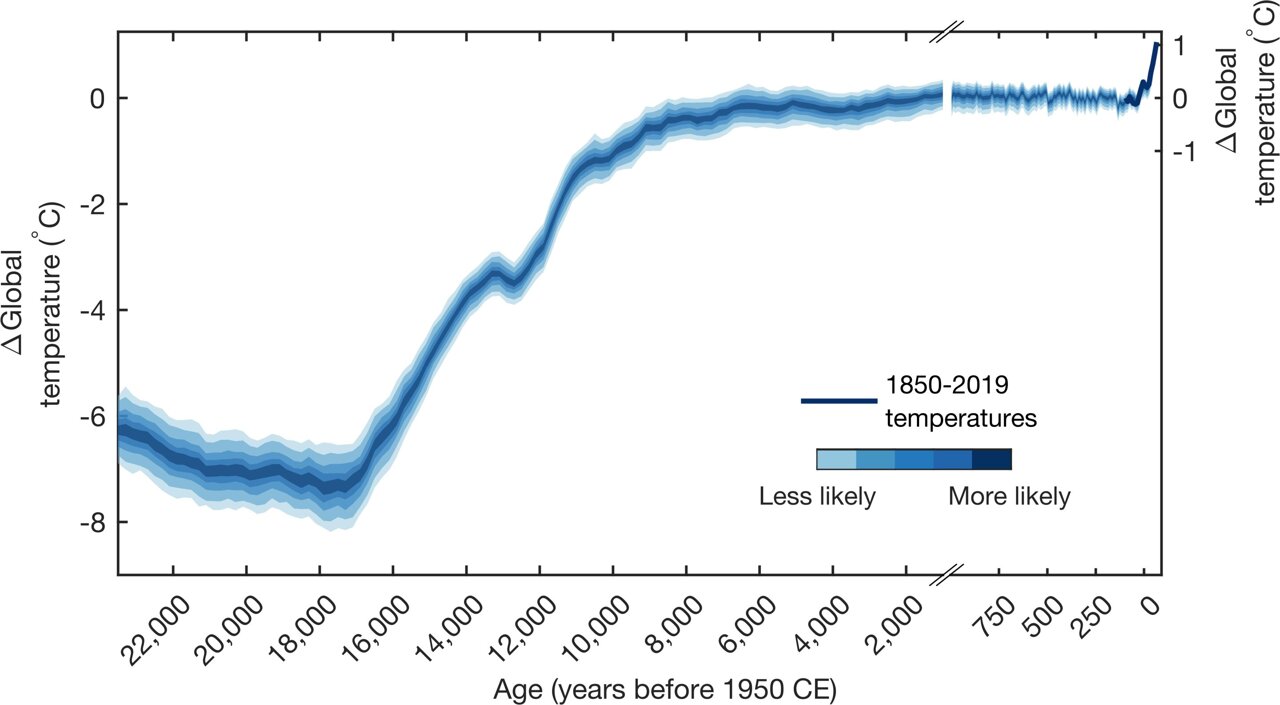
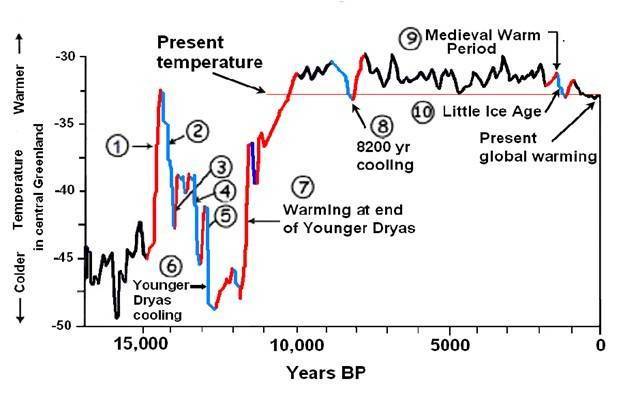
This puts this chart into perspective.
Today it was 100 F in Tallahassee Florida. Proof right?
Nope, not even close. The last time it was 100 F on this day was 80 years ago.
Not only that but the city of Tallahassee in a much bigger heat sink now than it was 80 years ago with a lot more construction and concrete going on nowadays.
So no warmer than 80 years ago, check
Tallahassee hits 100 degrees Friday, ties daily record high set over 80 years ago
Tallahassee ties a record-high setback in 1942.
www.wctv.tv
This puts this chart into perspective.


")