Navigation
Install the app
How to install the app on iOS
Follow along with the video below to see how to install our site as a web app on your home screen.

Note: This feature currently requires accessing the site using the built-in Safari browser.
More options
You are using an out of date browser. It may not display this or other websites correctly.
You should upgrade or use an alternative browser.
You should upgrade or use an alternative browser.
Pause in Sea Level Rise Tied to Massive Flooding in Australia
- Thread starter longknife
- Start date
I thought you were in the Navy admiral....
Good of you to finally admit you were spouting BS all those months. Now we can move on.
in your own words describe the cause of the Pacific ocean being 20cm higher than the Atlantic
No, that's the difference at Panama. For the whole oceans, the averages are.
Pacific = +42 cm
Indian = +20
Atlantic = 0
While many factors are at play, the main factor around Panama is that Pacific water is less dense than Atlantic water.
As far at the Med goes, it's a lower than the Atlantic and the Red Sea, the main factor there being that evaporation exceeds inflow from rivers.
Describe those factors please and how they interact.....
I thought you were in the Navy admiral....
Good of you to finally admit you were spouting BS all those months. Now we can move on.
in your own words describe the cause of the Pacific ocean being 20cm higher than the Atlantic
No, that's the difference at Panama. For the whole oceans, the averages are.
Pacific = +42 cm
Indian = +20
Atlantic = 0
While many factors are at play, the main factor around Panama is that Pacific water is less dense than Atlantic water.
As far at the Med goes, it's a lower than the Atlantic and the Red Sea, the main factor there being that evaporation exceeds inflow from rivers.
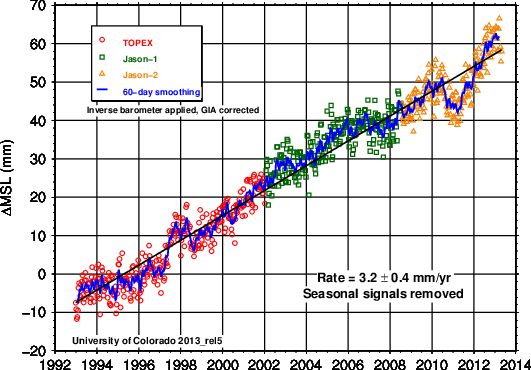
Wow.. so its NOT ALLabout gravity is it? So the GLOBAL AVERAGE shows a temporary shortfall of 4 or5 mm. Would you expect that shortage to b different if you only surveyed the Atlantc? Maybe LARGER IF U only surveyed the SW Pacific during that same period of time?
Or do u still insist it would b 4 mm regardless of how much of the ocean u used in the survey?
If I wasnt on a silly tablet toy Id pull a couple charts. Also..... the math for 5mm GLOBAL drop in SLevel being dropped into 5% of Aussieland
Doesnt pan out.
Last edited:
Don't you think if the sea level DID go down --- it would be FAR MORE NOTICEABLY LOCALLY?
Of course not, because water flows down a gravitational gradient.
You're essentially saying that if I take a cup of water out of the ocean, local sea level in that spot where I scooped the water from should remain lower, because water can't flow in to replace it. That's a really dumb theory, which is why there's no evidence of such an impossible thing happening.

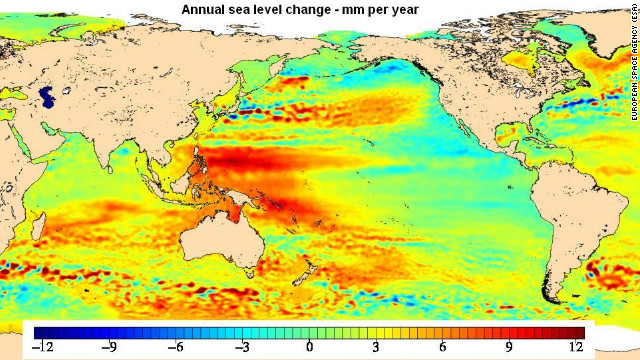
here are a couple of SLR maps by altimetry. with a record history that is now 20 years long, there are a great many spots where SLR is rising right next to areas that are dropping.
I concur that it seems very strange that one area can show greater than avg rise, year after year, with no apparent means by which to corral the water against spreading out into lower lying areas. I could understand a contour map due to gravity effects, but then that would just be relatively stable, neither rising or falling.
perhaps CO2 has superpowers
Saigon
Gold Member
perhaps CO2 has superpowers
Or perhaps you are misinterpreting the information....I suspect the latter.
It does seem a little odd to me that you would ask this here, rather than research and find the answer from your source.
I agree that it is bizarre to think of sea level rising 10 mm per year in one spot, and dropping 10 mm per year only a few miles away, but then I suspect that is not what the graph suggests.
Don't you think if the sea level DID go down --- it would be FAR MORE NOTICEABLY LOCALLY?
Of course not, because water flows down a gravitational gradient.
You're essentially saying that if I take a cup of water out of the ocean, local sea level in that spot where I scooped the water from should remain lower, because water can't flow in to replace it. That's a really dumb theory, which is why there's no evidence of such an impossible thing happening.
here are a couple of SLR maps by altimetry. with a record history that is now 20 years long, there are a great many spots where SLR is rising right next to areas that are dropping.
I concur that it seems very strange that one area can show greater than avg rise, year after year, with no apparent means by which to corral the water against spreading out into lower lying areas. I could understand a contour map due to gravity effects, but then that would just be relatively stable, neither rising or falling.
perhaps CO2 has superpowers
well Saigon, i'm all ears. tell me your interpretation. the map/graph says 1992-2008 and labels the colours as mm/year.
edit- the second one has data to 2010, I believe, and higher resolution. the pattern is very close to the same as the first map.
Last edited:
- Banned
- #48
I think we need to read up on the definition of "mean sea level". There is a decent article at Sea level - Wikipedia, the free encyclopedia.
I think we need to read up on the definition of "mean sea level". There is a decent article at Sea level - Wikipedia, the free encyclopedia.
speak up...whats your point?
Now this is fascinating..
Turns out the ole FlaCalTenn intuition was probably right. Six years of working in Earth Resource Satellite interpretation might have also helped..
I'm back attached to real computing work power and looked up the local charts to the East of AussieLand for the period in question.. What I'm seeing is mind-boggling..
Last few columns are SL min, max, mean, stddev.. For Vanuatu.. (Survivor season XX)
What you see for 2010 to 2011 is a MASSIVE drop of over 150mm...
That's over 50 yrs of negating "Sea Level Rise" for that period..
Now ain't that more decisive than trying to relate it to a mere 4 or 5 mm GLOBAL drop in SLevel ??
I think this "theory" might hold some water.. (I crack myself up)
But we need to be aware that this "drop" seems to be RE-OCCURING in the past few months.. ----- So maybe it's a combo of periodic weather phenom (el nina/nino, PDO, etc). Because RIGHT NOW --- Sea Level in that region is falling like a rock AGAIN... Maybe -- it signals the end of the abnormal piling of sea water in that region..
So much more insight on a Local Level for alleged Local events..
Feel free to plot it and match the shape and duration to the hokey "global" record of the anomaly...
Turns out the ole FlaCalTenn intuition was probably right. Six years of working in Earth Resource Satellite interpretation might have also helped..
I'm back attached to real computing work power and looked up the local charts to the East of AussieLand for the period in question.. What I'm seeing is mind-boggling..
Monthly sea levels for VANUATU
1 2008 0 7440 0.109 1.531 0.967 0.304
2 2008 0 6960 0.235 1.486 0.918 0.288
3 2008 0 7440 0.257 1.524 0.928 0.294
4 2008 0 7200 0.251 1.695 0.981 0.303
5 2008 0 7440 0.161 1.657 0.932 0.304
6 2008 0 7200 0.080 1.525 0.913 0.315
7 2008 0 7440 0.023 1.515 0.879 0.323
8 2008 0 7440 0.005 1.529 0.894 0.327
9 2008 0 7200 0.272 1.564 0.967 0.307
10 2008 0 7440 0.325 1.681 1.017 0.307
11 2008 0 7200 0.214 1.771 1.068 0.316
12 2008 0 7440 0.155 1.632 1.035 0.306
1 2009 861 6579 0.212 1.764 1.060 0.322
2 2009 5977 743 0.453 1.565 1.033 0.340
3 2009 0 7440 0.248 1.698 1.019 0.323
4 2009 0 7200 0.215 1.538 0.938 0.292
5 2009 0 7440 0.114 1.608 0.947 0.307
6 2009 0 7200 0.066 1.577 0.958 0.319
7 2009 0 7440 0.109 1.628 0.979 0.310
8 2009 0 7440 0.186 1.592 0.977 0.304
9 2009 0 7200 0.290 1.656 1.019 0.299
10 2009 0 7440 0.306 1.683 1.003 0.302
11 2009 0 7200 0.235 1.612 1.009 0.305
12 2009 0 7440 0.145 1.624 0.992 0.319
1 2010 0 7440 0.111 1.628 0.974 0.325
2 2010 0 6720 0.203 1.785 1.002 0.301
3 2010 0 7440 0.242 1.729 0.931 0.301
4 2010 0 7200 0.238 1.563 0.930 0.301
5 2010 0 7440 0.167 1.508 0.898 0.294
6 2010 0 7200 0.023 1.416 0.844 0.309
7 2010 0 7440 0.083 1.491 0.882 0.303
8 2010 0 7440 0.067 1.527 0.860 0.299
9 2010 0 7200 0.123 1.588 0.878 0.295
10 2010 0 7440 0.208 1.577 0.898 0.298
11 2010 0 7200 0.101 1.611 0.876 0.314
12 2010 0 7440 0.055 1.408 0.818 0.311
1 2011 0 7440 -0.016 1.449 0.841 0.314
2 2011 0 6720 0.119 1.577 0.824 0.304
3 2011 0 7440 0.012 1.509 0.810 0.308
4 2011 0 7200 0.124 1.646 0.934 0.309
5 2011 0 7440 0.145 1.579 0.957 0.303
6 2011 0 7200 0.165 1.597 0.947 0.310
7 2011 0 7440 0.119 1.625 0.962 0.333
8 2011 0 7440 0.208 1.619 0.957 0.330
9 2011 0 7200 0.248 1.696 0.926 0.321
10 2011 0 7440 0.159 1.741 0.969 0.324
11 2011 378 6822 0.064 1.592 0.922 0.322
12 2011 0 7440 0.223 1.701 0.986 0.307
1 2012 0 7440 0.122 1.571 0.952 0.307
2 2012 0 6960 0.170 1.511 0.882 0.316
3 2012 0 7440 0.228 1.529 0.908 0.293
4 2012 0 7200 0.125 1.518 0.853 0.300
5 2012 747 6693 0.038 1.610 0.877 0.323
6 2012 0 7200 0.059 1.604 0.916 0.323
7 2012 0 7440 0.053 1.553 0.899 0.328
8 2012 0 7440 0.143 1.552 0.933 0.316
9 2012 0 7200 0.307 1.589 0.940 0.304
10 2012 0 7440 0.135 1.550 0.890 0.305
11 2012 0 7200 0.072 1.627 0.934 0.306
12 2012 0 7440 0.112 1.633 0.946 0.308
1 2013 0 7440 0.083 1.637 0.974 0.317
2 2013 0 6720 0.156 1.546 0.916 0.309
3 2013 0 7440 0.210 1.480 0.874 0.310
4 2013 0 7200 0.050 1.444 0.816 0.308
5 2013 0 7440 0.021 1.507 0.785 0.309
6 2013 0 7200 -0.069 1.441 0.812 0.307
7 2013 0 7440 -0.040 1.551 0.803 0.320
Last few columns are SL min, max, mean, stddev.. For Vanuatu.. (Survivor season XX)
What you see for 2010 to 2011 is a MASSIVE drop of over 150mm...
That's over 50 yrs of negating "Sea Level Rise" for that period..
Now ain't that more decisive than trying to relate it to a mere 4 or 5 mm GLOBAL drop in SLevel ??
I think this "theory" might hold some water.. (I crack myself up)
But we need to be aware that this "drop" seems to be RE-OCCURING in the past few months.. ----- So maybe it's a combo of periodic weather phenom (el nina/nino, PDO, etc). Because RIGHT NOW --- Sea Level in that region is falling like a rock AGAIN... Maybe -- it signals the end of the abnormal piling of sea water in that region..
So much more insight on a Local Level for alleged Local events..
Feel free to plot it and match the shape and duration to the hokey "global" record of the anomaly...
Last edited:
So -- here is the plot of Vanuatu from 2006 to now.. X axis is in months since Jan 2006..
((That's because I need to go earn money))
So the anomaly is starts at about 48 ---> 60..

Something MAJOR is going on in the SW pacific.. This DOES affect the global average. But it's not clear that the multiple downtrends are due to water being physically dropped on the Aussie desert. Especially since --- the numbers are dramatically RACHETING DOWN again.. Literally 150mm of fall in that region repeatedly..
LOCALLY --- the sea level looks like someone pulled the drain plug.. Gravity... Hahahahahaha...
((That's because I need to go earn money))
So the anomaly is starts at about 48 ---> 60..
Something MAJOR is going on in the SW pacific.. This DOES affect the global average. But it's not clear that the multiple downtrends are due to water being physically dropped on the Aussie desert. Especially since --- the numbers are dramatically RACHETING DOWN again.. Literally 150mm of fall in that region repeatedly..
LOCALLY --- the sea level looks like someone pulled the drain plug.. Gravity... Hahahahahaha...
Last edited:
I thought you were in the Navy admiral....
Good of you to finally admit you were spouting BS all those months. Now we can move on.
in your own words describe the cause of the Pacific ocean being 20cm higher than the Atlantic
No, that's the difference at Panama. For the whole oceans, the averages are.
Pacific = +42 cm
Indian = +20
Atlantic = 0
While many factors are at play, the main factor around Panama is that Pacific water is less dense than Atlantic water.
As far at the Med goes, it's a lower than the Atlantic and the Red Sea, the main factor there being that evaporation exceeds inflow from rivers.
Wow.. so its NOT ALLabout gravity is it? So the GLOBAL AVERAGE shows a temporary shortfall of 4 or5 mm. Would you expect that shortage to b different if you only surveyed the Atlantc? Maybe LARGER IF U only surveyed the SW Pacific during that same period of time?
Or do u still insist it would b 4 mm regardless of how much of the ocean u used in the survey?
If I wasnt on a silly tablet toy Id pull a couple charts. Also..... the math for 5mm GLOBAL drop in SLevel being dropped into 5% of Aussieland
Doesnt pan out.
You were supposed to let him stretch his neck out a little further before you chopped it off man...
Wow.. so its NOT ALL about gravity is it?
Of course not. Why would you and Westwall think such a crazy thing? I certainly never said or implied it in any way, and I have no idea where you two came up with such nonsense.
In the future, you and Westwall need to start responding to what I actually say, instead of responding to what your voices told you I said.
Describe those factors please and how they interact.....
No. Your free education ends here. If you don't know what you're babbling about, at least have the decency to be polite when asking for help. While I'm happy to spend time educating those who are willing to learn, others are required to provide a Paypal donation up front, to compensate me for my time.
But since I am generous to a fault, I'll at least give you a word to start working with. Equipotential. Go get 'em, tiger.
Wow.. so its NOT ALL about gravity is it?
Of course not. Why would you and Westwall think such a crazy thing? I certainly never said or implied it in any way, and I have no idea where you two came up with such nonsense.
In the future, you and Westwall need to start responding to what I actually say, instead of responding to what your voices told you I said.
Here Kitty Kitty.. Post #38....
Mamooth says ::
Of course not, because water flows down a gravitational gradient.
You're essentially saying that if I take a cup of water out of the ocean, local sea level in that spot where I scooped the water from should remain lower, because water can't flow in to replace it. That's a really dumb theory, which is why there's no evidence of such an impossible thing happening.

Dayam -- I thought cats had better memories.. I'm not hearing voices.. You not even listening to your OWN caterwalling.
How about that 150mm CHANGE in ONE FREAKING YEAR just east of Australia eh??
And the repeat of that -- that seems to be happening AGAIN?
No comment? How does that alter your view of the "theory" in the OP ???

- Banned
- #56
I think we need to read up on the definition of "mean sea level". There is a decent article at Sea level - Wikipedia, the free encyclopedia.
speak up...whats your point?
That you all seem to be skipping over the land moving up and down with respect to either the center of the Earth or the geoid (WGS 84 or the like).
What ARE you using as a reference from which you are measuring sea level?
And how fast does this land movement occur?
I think we need to read up on the definition of "mean sea level". There is a decent article at Sea level - Wikipedia, the free encyclopedia.
speak up...whats your point?
That you all seem to be skipping over the land moving up and down with respect to either the center of the Earth or the geoid (WGS 84 or the like).
What ARE you using as a reference from which you are measuring sea level?
the satellite altimetry is calibrated to a subset of tidal gauges that are supposedly already corrected for the land rising or falling.
if you are saying that the anomolous ocean readings are artifacts of underwater seismic activity rather than true water level changes then you are simply repeating one of my points.
it is one thing to get data from the satellites, it is quite another to make sense out of it.
Dayam -- I thought cats had better memories.. I'm not hearing voices.
Pointing out gravity is _one_reason is not saying gravity is the only reason. You so badly want me to be wrong, you're abandoning logic to make it happen.
How about that 150mm CHANGE in ONE FREAKING YEAR just east of Australia eh??
How about it? And the repeat of that -- that seems to be happening AGAIN?
If you could state a coherent point, it would be much easier to talk about it. Since trying to nail the ocean to the wall is pointless, I'll wait for you do to that. Best I can tell now, you're saying that a seasonal variation in one spot means the global average must be wrong. As that's absurd, there surely must be more to it, right?
May well be a natural variation --- but it's not seasonal as the 10 yr record shows.
This massive move down of 150mm IS TIMED to the event in the OP.. But it is also CONTINUING down..
Point is --- It's pretty juvenile to leap to the FIRST conclusion someone puts in front of you (like the OP) without checking the peripheral facts and observations. SOMETHING is changing as far as those SL rate rises that WERE 3X higher than a global average.
Second point is --- it's also juvenile to be touting "global averages" for everything when you KNOW it will mask what can be learned about the system dynamics on a local or regional scale.. What shows on a global average is only about 2% of what happened locally.
Third point is --- Juvenile is a hallmark of current era Climate Science.. Slowly, Painfully, these clowns are getting better at thinking thru their assertions..
Similar threads
- Replies
- 79
- Views
- 990
- Replies
- 12
- Views
- 180
- Replies
- 17
- Views
- 203
- Replies
- 118
- Views
- 2K
Latest Discussions
- Replies
- 4K
- Views
- 76K
- Replies
- 24
- Views
- 157
- Replies
- 88
- Views
- 787
- Replies
- 240
- Views
- 2K
- Replies
- 287
- Views
- 1K
Forum List
-
-
-
-
-
Political Satire 8088
-
-
-
-
-
-
-
-
-
-
-
-
-
-
-
-
-
-
-
ObamaCare 781
-
-
-
-
-
-
-
-
-
-
-
Member Usernotes 471
-
-
-
-
-
-
-
-
-
-