Obama Plays.. Unemployment Card...?

60,000 a month compared to over 300 million? :eusa_whistle:

No, 60,000 households (around 110,000 individuals) to represent around 250,000,000 people. Children under16, the military, people in prison or other institutions aren't covered.

Sample size is fine.

Link???

Besides Statistiscs 101????
Sample Size Calculator - Confidence Level, Confidence Interval, Sample Size, Population Size, Relevant Population - Creative Research Systems
Population size around 250,000,000
Sample size around 120,000
95% confidence level
Interval of about 0.3%
Sample size is fine. Larger is better of course, but there is the practical expense.

Oh sure the sample size is fine??? it's about 1/2 that's required. But I'm looking for your link that says 60,000 were sampled. :)
 
Do you really want to stick with that? The unemployment numbers that are being reported today are not correct, Those numbers are not showing the true numbers of people being unemployed. Let's poll 200 households how about that?
How do you know they're not accurate? Oh it's just what you feel.

And while 60k households is adequate and it was down to 50k for a while, 50k wasn't quite good enough. Now how large a sole do you think is necessary and how would you pay for it?

Either we have had a lot of unreported deaths or we have lost a lot of Americans from unemployment numbers without adding any new jobs to match the lose. Really do you want to rehash that again?
Sure, if you're still not understanding. Not sure why you think deaths play a role. But yes a lot of people stopped working and haven't been replaced. Who says otherwise?
 
No, 60,000 households (around 110,000 individuals) to represent around 250,000,000 people. Children under16, the military, people in prison or other institutions aren't covered.

Sample size is fine.

Link???

Besides Statistiscs 101????
Sample Size Calculator - Confidence Level, Confidence Interval, Sample Size, Population Size, Relevant Population - Creative Research Systems
Population size around 250,000,000
Sample size around 120,000
95% confidence level
Interval of about 0.3%
Sample size is fine. Larger is better of course, but there is the practical expense.

Who makes this shit up?

This Sample Size Calculator is presented as a public service of Creative Research Systems survey software. You can use it to determine how many people you need to interview in order to get results that reflect the target population as precisely as needed. You can also find the level of precision you have in an existing sample.

According to the population and the actual unemployed the way this groups try's to sell you their product is bullshit. 60,000 households survey does not make up ONE HUNDRED AND FIFTHY MILLION HOUSEHOLDS.
 
Last edited:
How do you know they're not accurate? Oh it's just what you feel.

And while 60k households is adequate and it was down to 50k for a while, 50k wasn't quite good enough. Now how large a sole do you think is necessary and how would you pay for it?

Either we have had a lot of unreported deaths or we have lost a lot of Americans from unemployment numbers without adding any new jobs to match the lose. Really do you want to rehash that again?
Sure, if you're still not understanding. Not sure why you think deaths play a role. But yes a lot of people stopped working and haven't been replaced. Who says otherwise?

I understand it's fucking bullshit. That's what I understand. That's less than ONE PERCENT of all households in America.
 
Yup, I listened to Rush today...:lol:..

...and it seems by September the 20 week extension of unemployment with be canceled for all remaining States to make the unemployment numbers look good for the Obama 2012 election.

If you are unemployed, whether or not you are collecting Unemployment has no effect on the unemployment numbers.

BULLSHIT....That is precisely how U-3 is calculated.
It is the number of people collecting or having applied for unemployment benefits vs the BLS accepted number of eligible workers.
The fisgures DO NOT count those not collected benefits. The figures DO NOT count those who are not working and have given up looking for work.
The BLS has also reduced the number of "available" jobs to further skew the actual number of unemployed.
There is a criteria (U-6) which takes into account ALL eligible workers not currently employed. That gives a percentage of nearly 16% ACTUAL unemployed.
 

Besides Statistiscs 101????
Sample Size Calculator - Confidence Level, Confidence Interval, Sample Size, Population Size, Relevant Population - Creative Research Systems
Population size around 250,000,000
Sample size around 120,000
95% confidence level
Interval of about 0.3%
Sample size is fine. Larger is better of course, but there is the practical expense.

Oh sure the sample size is fine??? it's about 1/2 that's required. But I'm looking for your link that says 60,000 were sampled. :)

Your match is wrong, besides, how would you pay for 120,000 households/month? Like I said more is better, but this an expensive survey.

For all you want to know about the sampling: Technical Paper 66
 
He timed the extension of 99 weeks to expire within the last 3 months......now to get the rest of those suckers off the role so it looks better.

I don't think he's going to look too good to those that don't have a job.

And he will turn right around and BLAME Republicans...It's in the script.

Of course. Obama will campaign on "the republicans in the House blocked all of my attempts to 'put America back to work' with my jobs creating stimulus".
Problem is there are just enough dummies to believe this bullshit to make the presidential race a close one.
 
Besides Statistiscs 101????
Sample Size Calculator - Confidence Level, Confidence Interval, Sample Size, Population Size, Relevant Population - Creative Research Systems
Population size around 250,000,000
Sample size around 120,000
95% confidence level
Interval of about 0.3%
Sample size is fine. Larger is better of course, but there is the practical expense.

Oh sure the sample size is fine??? it's about 1/2 that's required. But I'm looking for your link that says 60,000 were sampled. :)

Your match is wrong, besides, how would you pay for 120,000 households/month? Like I said more is better, but this an expensive survey.

For all you want to know about the sampling: Technical Paper 66

You might by that lie of less than 1% of all households is enough to get a good survey, But I'm not.
Hell I doubt 60,000 would be enough just to do my state.
 
Last edited:
Yup, I listened to Rush today...:lol:..

...and it seems by September the 20 week extension of unemployment with be canceled for all remaining States to make the unemployment numbers look good for the Obama 2012 election.

If you are unemployed, whether or not you are collecting Unemployment has no effect on the unemployment numbers.

BULLSHIT....That is precisely how U-3 is calculated.
It is the number of people collecting or having applied for unemployment benefits vs the BLS accepted number of eligible workers.
The fisgures DO NOT count those not collected benefits. The figures DO NOT count those who are not working and have given up looking for work.
The BLS has also reduced the number of "available" jobs to further skew the actual number of unemployed.
There is a criteria (U-6) which takes into account ALL eligible workers not currently employed. That gives a percentage of nearly 16% ACTUAL unemployed.

Links? Because everything you said was wrong.
 
Oh sure the sample size is fine??? it's about 1/2 that's required. But I'm looking for your link that says 60,000 were sampled. :)

Your match is wrong, besides, how would you pay for 120,000 households/month? Like I said more is better, but this an expensive survey.

For all you want to know about the sampling: Technical Paper 66

You might by that lie of less than 1% of all households is enough to get a good survey, But I'm not.
Hell I doubt 60,000 would be enough just to do my state.

Ah, see the difference is that I've studied statistics and worked with statisticians, while you have not. I gave a link to a sample size calculator. Play with it. Learn.
 
Yup, I listened to Rush today...:lol:..

...and it seems by September the 20 week extension of unemployment with be canceled for all remaining States to make the unemployment numbers look good for the Obama 2012 election. Well, as we all know the unemployment figures are bullshit at best and many more unemployed will be filed under non-existent (unaccounted for) and also be receiving no unemployment benefits.

-- but Obama will look good to the uninformed for lower unemployment figures and blaming the Republicans is standard procedure I guess, so expect that and choose sides..

(I tried to get a link with some information on this but failed but I'm thinking this Obama ploy on the American people will be coming out soon...:eusa_shifty:)

When the unemployment ends, the people are dropped from the count.

It is the method democrats use to lower the rate. This comes as no surprise.
CON$ will always bitterly cling to their lies!!!


Making 9 Million Jobless "Vanish": How The Government Manipulates Unemployment Statistics

When we look at broad measures of jobs and population, then the beginning of 2012 was one of the worst months in US history, with a total of 2.3 million people losing jobs or leaving the workforce in a single month. Yet, the official unemployment rate showed a decline from 8.5% to 8.3% in January - and was such cheering news that it set off a stock rally.

How can there be such a stark contrast between the cheerful surface and an underlying reality that is getting worse?

The true unemployment picture is hidden by essentially splitting jobless Americans up and putting them inside one of three different "boxes": the official unemployment box, the full unemployment box, and the most obscure box, the workforce participation rate box.

WorkA.jpg


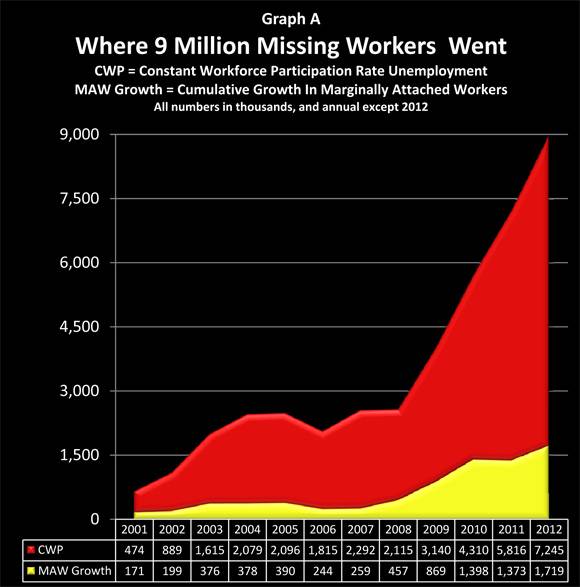
As we will explore herein, a detailed look at the government's own data base shows that about 9 million people without jobs have been removed from the labor force simply by the government defining them as not being in the labor force anymore. Indeed - effectively all of the decreases in unemployment rate percentages since 2009 have come not from new jobs, but through reducing the workforce participation rate so that millions of jobless people are removed from the labor force by definition.


WorkB.jpg


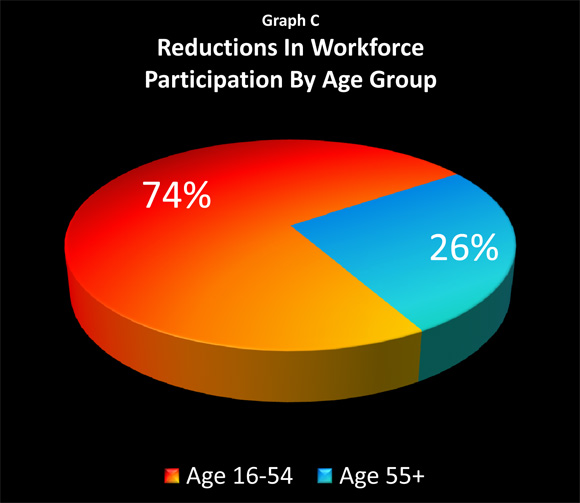
Based on in-depth analysis of the government's own numbers, we will present herein the true picture: 74% of the jobless who have been removed from unemployment calculations are in the 16-54 age bracket, with only 26% in the 55 and above bracket. Yes, the population is aging - but the heart of the workforce participation deception isn't about the old.

WorkC.jpg


Making 9 Million Jobless Vanish: How The Government Manipulates Unemployment Statistics
Interesting how he claims the govt is "removing people" without mentioning that classification is all by survey responses. And he fails to mention there is a category in not in the labor force of wants a job now and that his extra unemployed is far in excess of the number of people who say they want to work.
 
If you are unemployed, whether or not you are collecting Unemployment has no effect on the unemployment numbers.

BULLSHIT....That is precisely how U-3 is calculated.
It is the number of people collecting or having applied for unemployment benefits vs the BLS accepted number of eligible workers.
The fisgures DO NOT count those not collected benefits. The figures DO NOT count those who are not working and have given up looking for work.
The BLS has also reduced the number of "available" jobs to further skew the actual number of unemployed based on the assumption that 'lost jobs' will never come back or new ones will not be created to take their place.
There is a criteria (U-6) which takes into account ALL eligible workers not currently employed. That gives a percentage of nearly 16% ACTUAL unemployed.

Links? Because everything you said was wrong.

You really thought you were going to run me off? Look genius, I do my homework.
Never ask a question to which you do not already have the answer.
Alternative Measures of Labor Underutilization for States
 
Last edited:
When the unemployment ends, the people are dropped from the count.

It is the method democrats use to lower the rate. This comes as no surprise.
CON$ will always bitterly cling to their lies!!!
Based on in-depth analysis of the government's own numbers, we will present herein the true picture: 74% of the jobless who have been removed from unemployment calculations are in the 16-54 age bracket, with only 26% in the 55 and above bracket. Yes, the population is aging - but the heart of the workforce participation deception isn't about the old.

WorkC.jpg


Making 9 Million Jobless Vanish: How The Government Manipulates Unemployment Statistics
Like I have repeatedly shown CON$ always lie in packs.

This lie is easily disproved by "the government's own numbers" which the liar obviously didn't use and were posted here already numerous times so you have no excuse for not knowing you were posting a lie.

The BLS gives the details about the NILF group, including AGE. In April 2012 there were 18,216,000 age 16-24 persons NILF and 23,244,000 age 25-54 persons NILF for a TOTAL of 41,460,000 age 16-54 persons NILF. Now the liar says that 41,460,000 total is 74% of the total people NILF, but that combined 16-54 total is LESS than the 47,419,000 age 55+ persons NILF, which means that the liar's 74% is actually 47%, the liar reversed the numbers!!!! the actual percent over 55 is 53%

The CON$ervoFascist premeditated liar knew that no fellow traveler would bother to check his numbers and would just mindless parrot them and even if confronted with the lie the parrot would simply deny the truth and never check the numbers themselves.

Here are the real government AGE numbers for you CON$ to ignore.

A-38. Persons not in the labor force by desire and availability for work, age, and sex
 
Last edited:
Your match is wrong, besides, how would you pay for 120,000 households/month? Like I said more is better, but this an expensive survey.

For all you want to know about the sampling: Technical Paper 66

You might by that lie of less than 1% of all households is enough to get a good survey, But I'm not.
Hell I doubt 60,000 would be enough just to do my state.

Ah, see the difference is that I've studied statistics and worked with statisticians, while you have not. I gave a link to a sample size calculator. Play with it. Learn.

Even in the world of scientific studies you use a higher number to get a truthful result. Survey's of less than 1% of all household will not give an accurate finding. Sorry that pill will never be swallowed by someone who is intelligent no matter how much sugar you coat it with.
 
When the unemployment ends, the people are dropped from the count.

It is the method democrats use to lower the rate. This comes as no surprise.
CON$ will always bitterly cling to their lies!!!


Making 9 Million Jobless "Vanish": How The Government Manipulates Unemployment Statistics

When we look at broad measures of jobs and population, then the beginning of 2012 was one of the worst months in US history, with a total of 2.3 million people losing jobs or leaving the workforce in a single month. Yet, the official unemployment rate showed a decline from 8.5% to 8.3% in January - and was such cheering news that it set off a stock rally.

How can there be such a stark contrast between the cheerful surface and an underlying reality that is getting worse?

The true unemployment picture is hidden by essentially splitting jobless Americans up and putting them inside one of three different "boxes": the official unemployment box, the full unemployment box, and the most obscure box, the workforce participation rate box.

WorkA.jpg


As we will explore herein, a detailed look at the government's own data base shows that about 9 million people without jobs have been removed from the labor force simply by the government defining them as not being in the labor force anymore. Indeed - effectively all of the decreases in unemployment rate percentages since 2009 have come not from new jobs, but through reducing the workforce participation rate so that millions of jobless people are removed from the labor force by definition.


WorkB.jpg


Based on in-depth analysis of the government's own numbers, we will present herein the true picture: 74% of the jobless who have been removed from unemployment calculations are in the 16-54 age bracket, with only 26% in the 55 and above bracket. Yes, the population is aging - but the heart of the workforce participation deception isn't about the old.

WorkC.jpg


Making 9 Million Jobless Vanish: How The Government Manipulates Unemployment Statistics

Only an idiot or a government sill would disagree with you.
 
BULLSHIT....That is precisely how U-3 is calculated.
It is the number of people collecting or having applied for unemployment benefits vs the BLS accepted number of eligible workers.
The fisgures DO NOT count those not collected benefits. The figures DO NOT count those who are not working and have given up looking for work.
The BLS has also reduced the number of "available" jobs to further skew the actual number of unemployed based on the assumption that 'lost jobs' will never come back or new ones will not be created to take their place.
There is a criteria (U-6) which takes into account ALL eligible workers not currently employed. That gives a percentage of nearly 16% ACTUAL unemployed.

Links? Because everything you said was wrong.

You really thought you were going to run me off? Look genius, I do my homework.
Never ask a question to which you do not already have the answer.
Alternative Measures of Labor Underutilization for States

BZZT.

Wrong.
 

Forum List

Back
Top