http://www.nature.com/nature/journal/v484/n7392/full/nature10915.html
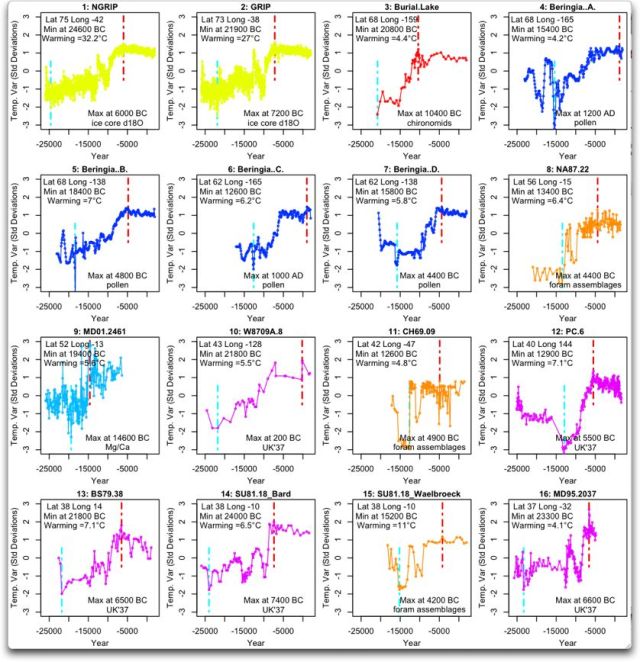
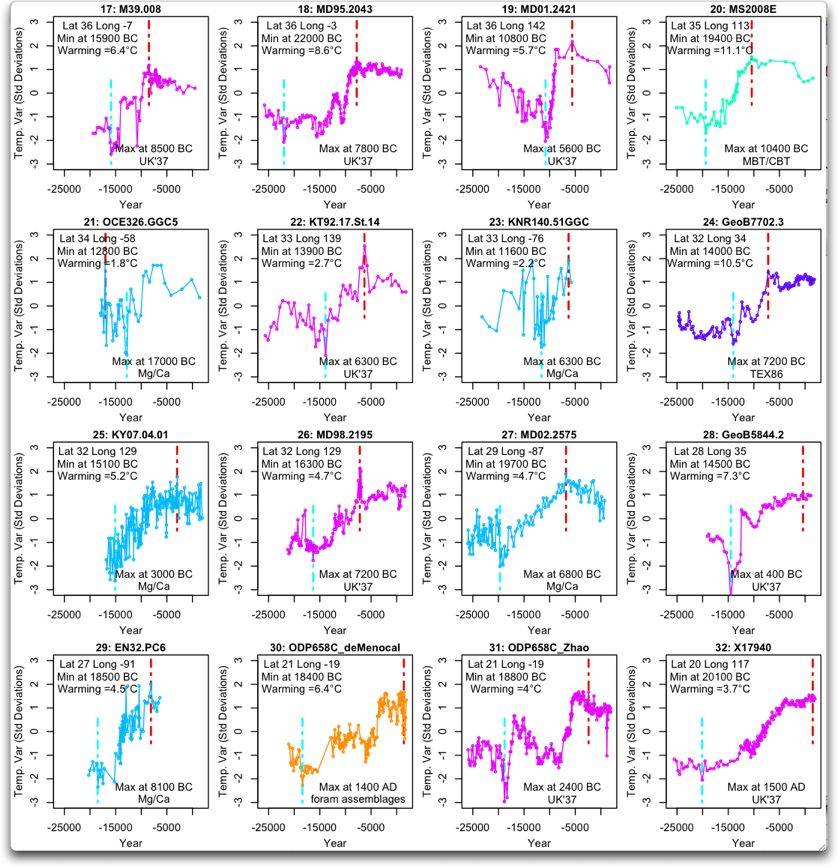
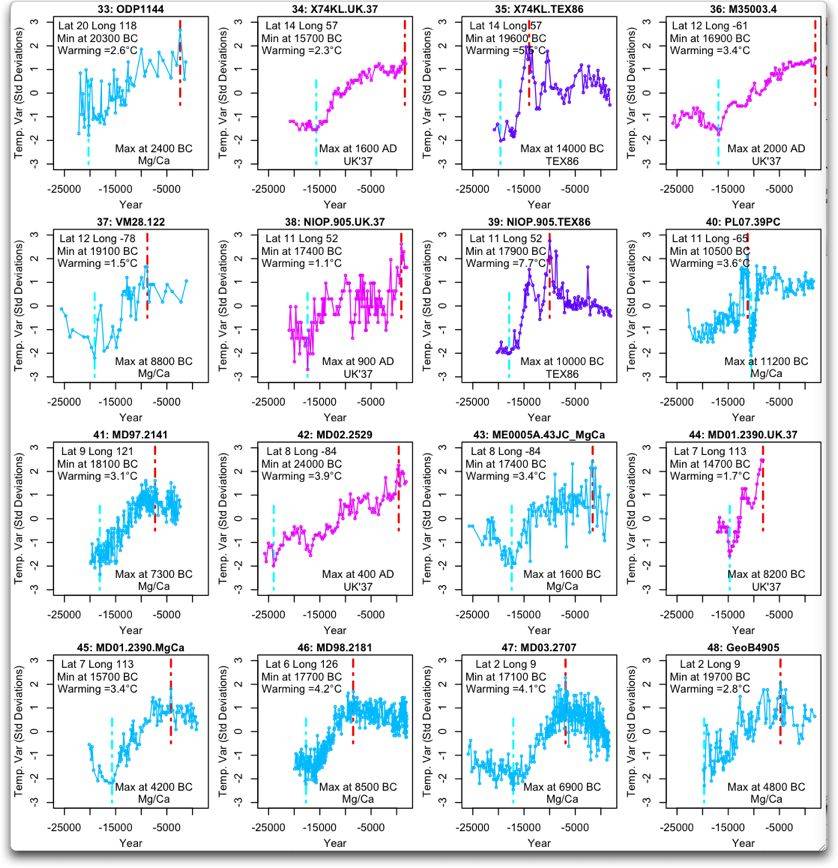
there is the link, although it is paywalled. fortunately the SI is freely available. W Eschenbach (freelance writer at WUWT) took the data and plotted it up
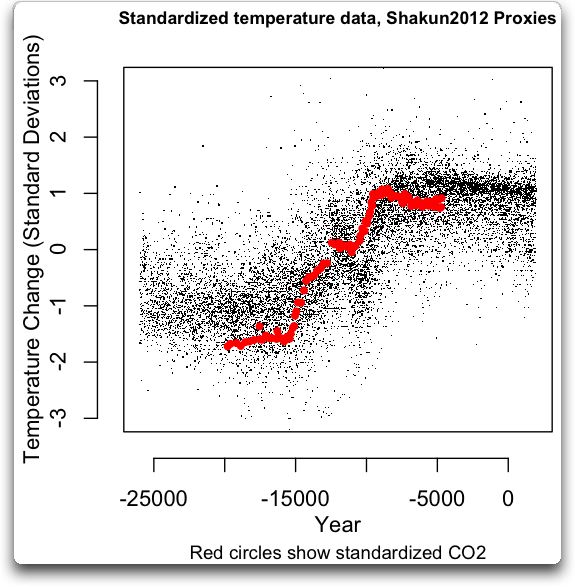
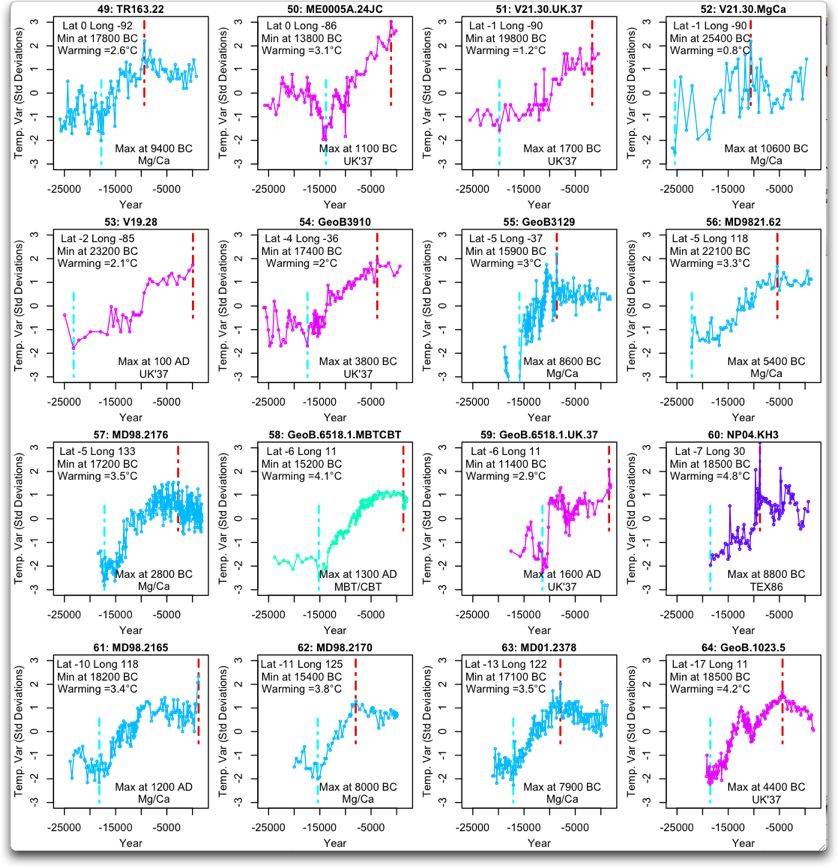
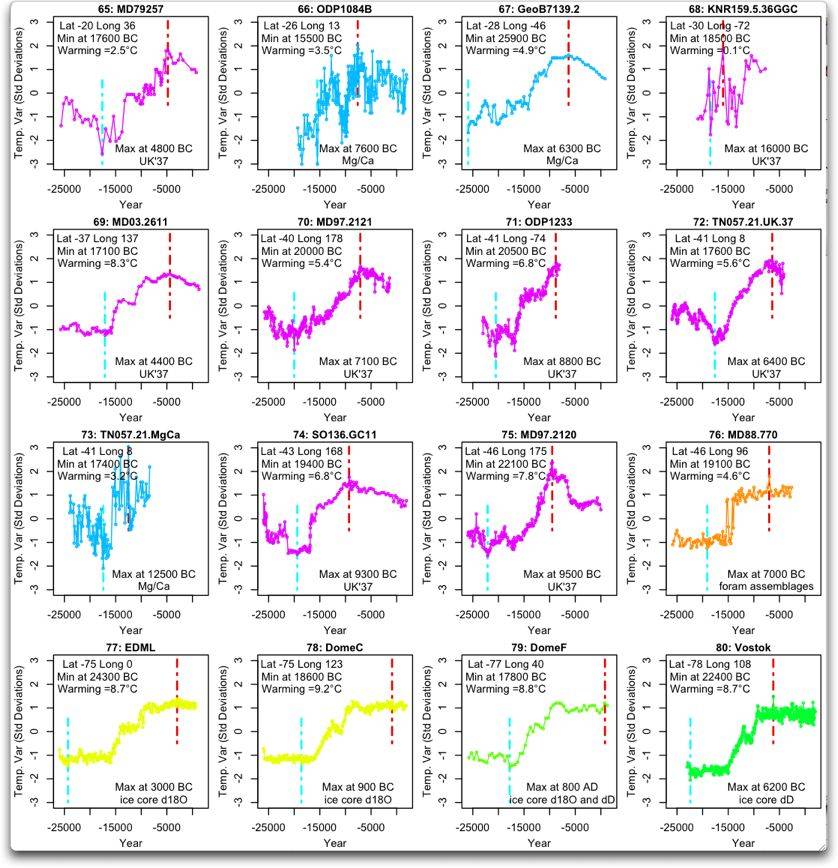
I recommend reading the article because it also plots all the individual proxies in thumbnail so that you can see the basic process.A reply to Shakun et al – Dr. Munchausen Explains Science By Proxy | Watts Up With That?
all-in-all a very interesting description which gives a better idea about the uncertainties in using proxy data than the clear crisp lines usually used in science papers.
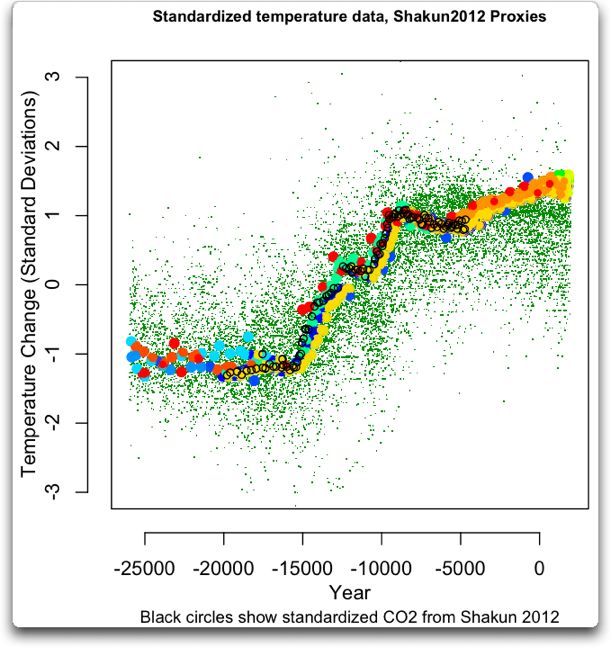
but Willis wasnt finished. he wondered why Shakun2012 only used one CO2 record so he found a bunch of other ice core records for the same period and plotted them up as well.
 Shakun Redux: Master tricksed us! I told you he was tricksy! | Watts Up With That?
imagine that!!!
CO2 increasing while temperature was decreasing for the last 5000 years! isnt that odd?
I understand the tendency of scientists to make as strong a case for their work as possible but I am getting tired of papers chopping off inconvenient data for the sake of 'the cause'. Old Rocks and others denigrate blogs (that they dont agree with) but where else are you going to find information and analysis to form a more complete picture of what is going on? I noticed that the CO2 record stopped short in the original but I basically ignored it because I couldnt do anything about it. what percentage of people would notice that inconsistency and then be able to do something about it? one in ten thousand? so what happened to peer review, why didnt they insist that the record be extended to match the time period of the temperatures?
the problem with being a slave to authority is that you dont get to hear the objections. I dont have a big problem with Shakur2012 but I dont think they really proved their conclusion that CO2 increased first, then temperature. there are some studies one way, others show the reverse. but I am pissed off that they broke the rules of scientific investigation to make their case stronger, knowing that most people wouldnt catch on or be able to do anything about it.
there is the link, although it is paywalled. fortunately the SI is freely available. W Eschenbach (freelance writer at WUWT) took the data and plotted it up
I recommend reading the article because it also plots all the individual proxies in thumbnail so that you can see the basic process.A reply to Shakun et al – Dr. Munchausen Explains Science By Proxy | Watts Up With That?
all-in-all a very interesting description which gives a better idea about the uncertainties in using proxy data than the clear crisp lines usually used in science papers.
but Willis wasnt finished. he wondered why Shakun2012 only used one CO2 record so he found a bunch of other ice core records for the same period and plotted them up as well.
imagine that!!!
CO2 increasing while temperature was decreasing for the last 5000 years! isnt that odd?
I understand the tendency of scientists to make as strong a case for their work as possible but I am getting tired of papers chopping off inconvenient data for the sake of 'the cause'. Old Rocks and others denigrate blogs (that they dont agree with) but where else are you going to find information and analysis to form a more complete picture of what is going on? I noticed that the CO2 record stopped short in the original but I basically ignored it because I couldnt do anything about it. what percentage of people would notice that inconsistency and then be able to do something about it? one in ten thousand? so what happened to peer review, why didnt they insist that the record be extended to match the time period of the temperatures?
the problem with being a slave to authority is that you dont get to hear the objections. I dont have a big problem with Shakur2012 but I dont think they really proved their conclusion that CO2 increased first, then temperature. there are some studies one way, others show the reverse. but I am pissed off that they broke the rules of scientific investigation to make their case stronger, knowing that most people wouldnt catch on or be able to do anything about it.