Mind-Blowing Temperature Fraud At NOAA

Ernie S.

Diamond Member
Nov 14, 2010
34,710
9,211
1,340
Sweet Home Alabama
Mind-Blowing Temperature Fraud At NOAA
Posted on July 27, 2015 by stevengoddard
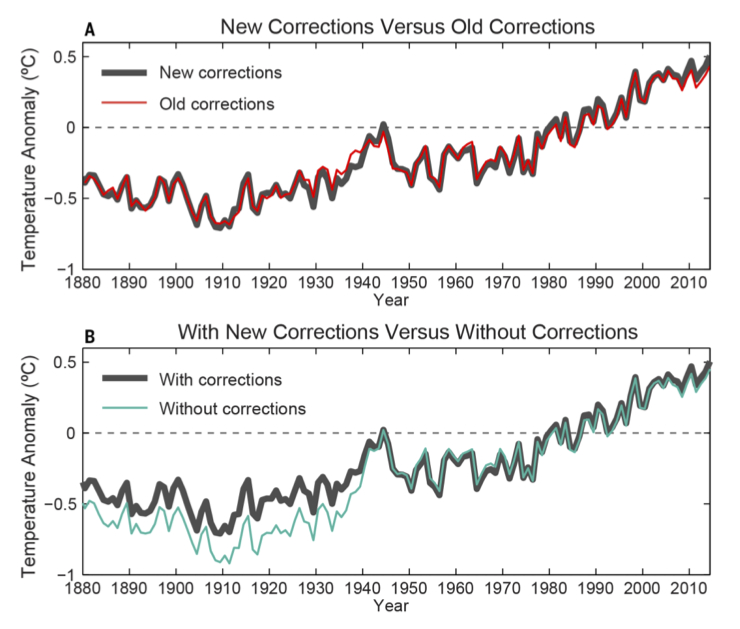
The measured US temperature data from USHCN shows that the US is on a long-term cooling trend. But the reported temperatures from NOAA show a strong warming trend.

ScreenHunter_10009-Jul.-27-12.16.gif


So warmers. How much more do you need?
 
Stunning to see the historical climate network, which has now been heavily altered in comparison with the well sited and QC'ed sites of CRN. Shows the fraud they are committing outright. Then if we line up RSS and UAH satellite coverage of 85% of the globe and find it matched the US-CRN trend perfectly, we find that NASA-(GISS) and NOAA dont have any legs to stand on to justify their adjustments. They were given enough rope to hang themselves with... And they did it to themselves... Priceless..
 
RealClimate NOAA temperature record updates and the hiatus

noaa_update.jpg

Figure 2 from Karl et al (2015), showing the impact of the new data and corrections. A) New and old estimates, B) the impact of all corrections on the new estimate. - See more at: RealClimate NOAA temperature record updates and the hiatus


Model-observation comparisons are not greatly affected by this update

I’ve been remiss in updating these comparisons (see 2012, 2011, and 2010), but this is a good opportunity to do so. First, I show how the CMIP3 model-data comparisons are faring. This is a clean continuation to what I’ve shown before:


model14.jpg

It is clear that temperatures are well within the expected range, regardless of the NCDC/NCEI version. Note that the model range encompasses all of the simulated internal variability as well as an increasing spread over time which is a function of model structural uncertainty. These model simulations were performed in 2004 or so, using forcings that were extrapolated from 2000.

- See more at: RealClimate NOAA temperature record updates and the hiatus
 
Using more fudged data?

You don't get it. They have been caught SO many times, they have lost all credibility. It's over.
 
Matthew- most of the criticisms of karl15 involve just the last two decades, exactly where the largest divergence happens. spreading the graph back to 1880 is answering a question that wasnt asked. likewise with the 'bucket adjustment' from 1880-1940. there are problems there too, but that isnt the point of karl15. adjusting state of the art buoy data to match much less reliable engine intake data is the point (or at least one of them).

what's the deal with making the 'new corrections' line three times wider than the old corrections line? to minimize the optical difference? oddly done

I also think it is funny that the comparison to models, forecast from 2000 but performed in at least 2004, start diverging in 2005 and keep dropping. except for Cowtan and Way, the previous attempt at rearranging the methodologies to get rid of the Pause and the divergence from the models. anybody want to bet against the next 'improvement' also being in the direction of supporting the CO2 story against the ravages of reality?
 
Using more fudged data?

You don't get it. They have been caught SO many times, they have lost all credibility. It's over.

It would be you that doesn't get it. They haven't been "caught" at anything. None of you have provided the slightest shred of evidence that ANY of the various adjustments made to temperature data of all sorts is unjustified. Until you get to Karl et al 2015, the sum of adjustments has REDUCED the measured warming.


that's a red herring. if you want to discuss the bucket adjustment, start a thread on it. it is a large warming adjustment that mostly warms pre1940 sea surface temperatures.

the land only adjustments warm the present and cool the past, increasing the trend. there are lots of those adjustments we can discuss. and they are separate from other adjustments.

or we could discuss just the new karl15 adjustments like setting modern buoy data to old engine intake data. or the claim that NMAT was used to correct certain parts but the trend somehow got exaggerated. or how land temps were extrapolated hundreds and thousand of kilometers out into the Arctic ocean. etc.
 
Using more fudged data?

You don't get it. They have been caught SO many times, they have lost all credibility. It's over.
If only you were right about it being over. The warmers will never give up no matter how much fudged data or data that disproves AGW. It is a religion to these people and they just plain believe it.

BO, Cankles, and others have recently pronounced how we are all going to die unless big government stops global warming. Of course they are self serving liars, but millions of dumb Americans believe their lies.
 
RealClimate NOAA temperature record updates and the hiatus

noaa_update.jpg

Figure 2 from Karl et al (2015), showing the impact of the new data and corrections. A) New and old estimates, B) the impact of all corrections on the new estimate. - See more at: RealClimate NOAA temperature record updates and the hiatus


Model-observation comparisons are not greatly affected by this update

I’ve been remiss in updating these comparisons (see 2012, 2011, and 2010), but this is a good opportunity to do so. First, I show how the CMIP3 model-data comparisons are faring. This is a clean continuation to what I’ve shown before:


model14.jpg

It is clear that temperatures are well within the expected range, regardless of the NCDC/NCEI version. Note that the model range encompasses all of the simulated internal variability as well as an increasing spread over time which is a function of model structural uncertainty. These model simulations were performed in 2004 or so, using forcings that were extrapolated from 2000.

- See more at: RealClimate NOAA temperature record updates and the hiatus

Still using the heavily altered data set... You really dont get it, do you? The data set alterations, making it show correlation to modeling, is fraud. Instead of throwing out the old model, they are twisting the data set and the well sited ground sites, that are quality controlled, show the fraud. They have hoisted themselves on their own petard.
 
Last edited:
Poor Frank is so hilariously ignorant of basic statistics. I could explain it to him. I have explained it to him. It never helps. He's too emotionally invested in remaining ignorant.

As far as Ian's odd conspiracy theory goes, let's check data for the south pole station. The temperatures for the last 7 years have been adjusted downward strongly. And that single station probably covers more land area than all of Ian's cherrypicks combined.

ftp://ftp.ncdc.noaa.gov/pub/data/ghcn/v3/products/stnplots/7/70089009000.gif

And if we look at the June 2015 map, the least-covered areas -- the Antarctic -- are the coolest. Africa is not particularly war. Boom, another Ian conspiracy crashes down.

GISSJun15.gif
Again with fudged data. Using lies to confirm other lies is still lying.
 
Using more fudged data?

You don't get it. They have been caught SO many times, they have lost all credibility. It's over.

It would be you that doesn't get it. They haven't been "caught" at anything. None of you have provided the slightest shred of evidence that ANY of the various adjustments made to temperature data of all sorts is unjustified. Until you get to Karl et al 2015, the sum of adjustments has REDUCED the measured warming.
well dude, why is the data being adjusted? You are admitting changes were made correct? Why? Asked you that before.
 
just to remind all what was posted in January by Skooks:
The models are a joke. Anybody not a committed AGW religion member takes one look at the history of the "models" and can see........real scientists don't mess with data. Because that's what real scientists do.

Robert Zimmerman's stuff is dizzying it is so spot on......decimates the phony/rigged models pervasive in the climate science community >>

The models are wrong Behind The Black


Global warming data FAKED by government to fit climate change fictions - NaturalNews.com


NOAA quietly revises website after getting caught in global warming lie admitting 1936 was hotter than 2012 - NaturalNews.com

Why global warming science is nothing but fraud - English pravda.ru


Fakegate The Obnoxious Fabrication of Global Warming - Forbes
 
Skooks is on ignore forever. He won't be coming back.

jc, show us some actual EVIDENCE that adjustments NOAA has made were not jusitified. Show us some evidence that what you and all your denier brethren have repeatedly termed "fraud" actually is such a thing.
 

Forum List

Back
Top