Inhofe Exposes Global Warming Hoax

No, thicker person, there is no baseline for the actual instruments because Hansen keeps "adjusting" them. Try to keep up with what;s being discussed instead of blathering on about your particular bit of drivel. We don't KNOW what the measurements are because they keep getting changed. Got it? That's the issue. If the instruments keep getting adjusted after the fact you don't know what the hell the readings are do you smart guy.

That's correct, you can't have an "average" if the meter is constantly being adjusted and/or calibrated.


Instrumentation is calibrated to "standards". For temperature that could be as simple as a container of ice water ... the temperature should read exactly 32 degrees F. For boiling ...212 degrees F at sea level. There are calibrated standards to do the same thing. If the meter is not calibrated, there can be quite a bit (comparatively speaking in tenths of degrees) of drift. If your meter is checked periodically and found to be "in tolerance", you can be sure the readings are accurate, usually within hundreds of a degree. If the meter is found out of tolerance, that should be noted and the meter data disregarded and the meter calibrated or replaced. Has this been done?
For most temperature readings in remote sites, a weather station is only checked when information is not being sent (transmitted). The calibration is not checked until it is very obvious the readings are inaccurate. The global warming religion uses these readings without verifying the accuracy.


This is true, even more to the point they use weather stations in built up areas that will be affect by the Urban Island Effect and don't correct for that warming at all. That's how they get "record" warm years year after year. But edthecynic is too smart to be taken in by that nonsense....right
 
That's correct, you can't have an "average" if the meter is constantly being adjusted and/or calibrated.


Instrumentation is calibrated to "standards". For temperature that could be as simple as a container of ice water ... the temperature should read exactly 32 degrees F. For boiling ...212 degrees F at sea level. There are calibrated standards to do the same thing. If the meter is not calibrated, there can be quite a bit (comparatively speaking in tenths of degrees) of drift. If your meter is checked periodically and found to be "in tolerance", you can be sure the readings are accurate, usually within hundreds of a degree. If the meter is found out of tolerance, that should be noted and the meter data disregarded and the meter calibrated or replaced. Has this been done?
For most temperature readings in remote sites, a weather station is only checked when information is not being sent (transmitted). The calibration is not checked until it is very obvious the readings are inaccurate. The global warming religion uses these readings without verifying the accuracy.
This is true, even more to the point they use weather stations in built up areas that will be affect by the Urban Island Effect and don't correct for that warming at all. That's how they get "record" warm years year after year. But edthecynic is too smart to be taken in by that nonsense....right
that's a load of crap, and YOU know it because it has been explained to you repeatedly on many different threads.

If the station is near a heat source, the 30 year average that the anomaly is measured against will be warmer compensating for the heat source.
 
Instrumentation is calibrated to "standards". For temperature that could be as simple as a container of ice water ... the temperature should read exactly 32 degrees F. For boiling ...212 degrees F at sea level. There are calibrated standards to do the same thing. If the meter is not calibrated, there can be quite a bit (comparatively speaking in tenths of degrees) of drift. If your meter is checked periodically and found to be "in tolerance", you can be sure the readings are accurate, usually within hundreds of a degree. If the meter is found out of tolerance, that should be noted and the meter data disregarded and the meter calibrated or replaced. Has this been done?
For most temperature readings in remote sites, a weather station is only checked when information is not being sent (transmitted). The calibration is not checked until it is very obvious the readings are inaccurate. The global warming religion uses these readings without verifying the accuracy.
This is true, even more to the point they use weather stations in built up areas that will be affect by the Urban Island Effect and don't correct for that warming at all. That's how they get "record" warm years year after year. But edthecynic is too smart to be taken in by that nonsense....right
that's a load of crap, and YOU know it because it has been explained to you repeatedly on many different threads.

If the station is near a heat source, the 30 year average that the anomaly is measured against will be warmer compensating for the heat source.


No, Ed you're wrong. It is well documented that NOAA has dropped 6000 weather stations from rural areas and focused their attention on only those in urban settings. We are using fewer weather stations than at any time since 1915. You can thank your activist alarmists for the degradation of science here. That is your side, not ours. Pull your head out of your rear and check for yourself.

You are are the one here who doesn't seem to understand that you can't play with the temp records. There is no temp record anymore, it is all crap thanks to Hansen and Co.
 
This is true, even more to the point they use weather stations in built up areas that will be affect by the Urban Island Effect and don't correct for that warming at all. That's how they get "record" warm years year after year. But edthecynic is too smart to be taken in by that nonsense....right
that's a load of crap, and YOU know it because it has been explained to you repeatedly on many different threads.

If the station is near a heat source, the 30 year average that the anomaly is measured against will be warmer compensating for the heat source.
No, Ed you're wrong. It is well documented that NOAA has dropped 6000 weather stations from rural areas and focused their attention on only those in urban settings. We are using fewer weather stations than at any time since 1915. You can thank your activist alarmists for the degradation of science here. That is your side, not ours. Pull your head out of your rear and check for yourself.

You are are the one here who doesn't seem to understand that you can't play with the temp records. There is no temp record anymore, it is all crap thanks to Hansen and Co.
That is a complete load of crap from the whackos at WUWT who have no credibility at all. If they dropped 6,00 stations there would be no stations. Only DUPLICATE stations were eliminated because of Bush II budget cuts!!! Why don't you deniers fund the reopening of the duplicate sties???? Oh that's Right, you know they're duplicates and if you opened them you would only CONFIRM Hansen's data. Much better for deniers to make up lies.

BTW, they checked to see if there was a bias from poorly sited stations after you deniers whined about them and they found the bias was for mostly COOLER readings. So were deniers happy when the poorly sited stations were removed from the data sets? Hell no, they then condemned Hansen for correcting the data and posting adjusted charts with the poorly sited stations removed. NOAA make all this info freely available to all, including you deniers, but deniers prefer to ignore it.

The USHCN Version 2 Serial Monthly Dataset

Station siting and U.S. surface temperature trends
Recent photographic documentation of poor siting conditions at stations in the USHCN has led to questions regarding the reliability of surface temperature trends over the conterminous U.S. (CONUS). To evaluate the potential impact of poor siting/instrument exposure on CONUS temperatures, Menne et al. (2010) compared trends derived from poor and well-sited USHCN stations using both unadjusted and bias-adjusted data. Results indicate that there is a mean bias associated with poor exposure sites relative to good exposure sites in the unadjusted USHCN version 2 data; however, this bias is consistent with previously documented changes associated with the widespread conversion to electronic sensors in the USHCN during the last 25 years (see e.g., Menne et al. 2009). Moreover, the sign of the bias is counterintuitive to photographic documentation of poor exposure because associated instrument changes have led to an artificial negative (“cool”) bias in maximum temperatures and only a slight positive (“warm”) bias in minimum temperatures.

Adjustments applied to USHCN Version 2 data largely account for the impact of instrument and siting changes, although a small overall residual negative (“cool”) bias appears to remain in the adjusted USHCN version 2 CONUS average maximum temperature. Nevertheless, the adjusted USHCN CONUS temperatures are well aligned with recent measurements from the U.S. Climate Reference Network (USCRN). This network was designed with the highest standards for climate monitoring and has none of the siting and instrument exposure problems present in USHCN. The close correspondence in nationally averaged temperature from these two networks is further evidence that the adjusted USHCN data provide an accurate measure of the U.S. temperature.

The Menne et al. (2010) results underscore the need to consider all changes in observation practice when determining the impacts of siting irregularities. Further, the influence of non-standard siting on temperature trends can only be quantified through an analysis of the data which do not indicate that the CONUS average temperature trends are inflated due to poor station siting.

Four sets of USCHN stations were used in the Menne et al. (2010) analysis. Set 1 includes stations identified as having good siting by the volunteers at surfacestations.org. Set 2 is a subset of set 1 consisting of the set 1 stations whose ratings are in general agreement with an independent assessment by NOAA’s National Weather Service. Set 3 are those stations with moderate to poor siting ratings according to surfacestations.org. Set 4 is a subset of set 3 consisting of the set 3 stations whose ratings are in agreement with an independent assessment by NOAA’s National Weather Service. For further information, please see Menne et al. (2010). The set of Maximum Minimum Temperature Sensor (MMTS) stations and Cotton Region Shelter (Stevenson Screen) sites used in Menne et al. (2010) are also available (see the "readme.txt" file as described below for a description of the station list format). Access to the unadjusted, time of observation adjusted, and fully adjusted USHCN version 2 temperature data is described below.

Data Access
U.S. HCN version 2 monthly data are available via ftp at ftp://ftp.ncdc.noaa.gov/pub/data/ushcn/v2/monthly/. Please see the "readme.txt" file in this directory for information on downloading and reading U.S HCN v2 data. Version control information is provided in the "status.txt" file.


I'm happy to see your blind hatred prevents you from looking at the evidence. Reinforces my low opinion of you further. NOAA still uses 1500 weather stations but hey don't let a little thing like a fact bother you.
 
No, Ed you're wrong. It is well documented that NOAA has dropped 6000 weather stations from rural areas and focused their attention on only those in urban settings. We are using fewer weather stations than at any time since 1915. You can thank your activist alarmists for the degradation of science here. That is your side, not ours. Pull your head out of your rear and check for yourself.

You are are the one here who doesn't seem to understand that you can't play with the temp records. There is no temp record anymore, it is all crap thanks to Hansen and Co.
That is a complete load of crap from the whackos at WUWT who have no credibility at all. If they dropped 6,00 stations there would be no stations. Only DUPLICATE stations were eliminated because of Bush II budget cuts!!! Why don't you deniers fund the reopening of the duplicate sties???? Oh that's Right, you know they're duplicates and if you opened them you would only CONFIRM Hansen's data. Much better for deniers to make up lies.

BTW, they checked to see if there was a bias from poorly sited stations after you deniers whined about them and they found the bias was for mostly COOLER readings. So were deniers happy when the poorly sited stations were removed from the data sets? Hell no, they then condemned Hansen for correcting the data and posting adjusted charts with the poorly sited stations removed. NOAA make all this info freely available to all, including you deniers, but deniers prefer to ignore it.

The USHCN Version 2 Serial Monthly Dataset

Station siting and U.S. surface temperature trends
Recent photographic documentation of poor siting conditions at stations in the USHCN has led to questions regarding the reliability of surface temperature trends over the conterminous U.S. (CONUS). To evaluate the potential impact of poor siting/instrument exposure on CONUS temperatures, Menne et al. (2010) compared trends derived from poor and well-sited USHCN stations using both unadjusted and bias-adjusted data. Results indicate that there is a mean bias associated with poor exposure sites relative to good exposure sites in the unadjusted USHCN version 2 data; however, this bias is consistent with previously documented changes associated with the widespread conversion to electronic sensors in the USHCN during the last 25 years (see e.g., Menne et al. 2009). Moreover, the sign of the bias is counterintuitive to photographic documentation of poor exposure because associated instrument changes have led to an artificial negative (“cool”) bias in maximum temperatures and only a slight positive (“warm”) bias in minimum temperatures.

Adjustments applied to USHCN Version 2 data largely account for the impact of instrument and siting changes, although a small overall residual negative (“cool”) bias appears to remain in the adjusted USHCN version 2 CONUS average maximum temperature. Nevertheless, the adjusted USHCN CONUS temperatures are well aligned with recent measurements from the U.S. Climate Reference Network (USCRN). This network was designed with the highest standards for climate monitoring and has none of the siting and instrument exposure problems present in USHCN. The close correspondence in nationally averaged temperature from these two networks is further evidence that the adjusted USHCN data provide an accurate measure of the U.S. temperature.

The Menne et al. (2010) results underscore the need to consider all changes in observation practice when determining the impacts of siting irregularities. Further, the influence of non-standard siting on temperature trends can only be quantified through an analysis of the data which do not indicate that the CONUS average temperature trends are inflated due to poor station siting.

Four sets of USCHN stations were used in the Menne et al. (2010) analysis. Set 1 includes stations identified as having good siting by the volunteers at surfacestations.org. Set 2 is a subset of set 1 consisting of the set 1 stations whose ratings are in general agreement with an independent assessment by NOAA’s National Weather Service. Set 3 are those stations with moderate to poor siting ratings according to surfacestations.org. Set 4 is a subset of set 3 consisting of the set 3 stations whose ratings are in agreement with an independent assessment by NOAA’s National Weather Service. For further information, please see Menne et al. (2010). The set of Maximum Minimum Temperature Sensor (MMTS) stations and Cotton Region Shelter (Stevenson Screen) sites used in Menne et al. (2010) are also available (see the "readme.txt" file as described below for a description of the station list format). Access to the unadjusted, time of observation adjusted, and fully adjusted USHCN version 2 temperature data is described below.

Data Access
U.S. HCN version 2 monthly data are available via ftp at ftp://ftp.ncdc.noaa.gov/pub/data/ushcn/v2/monthly/. Please see the "readme.txt" file in this directory for information on downloading and reading U.S HCN v2 data. Version control information is provided in the "status.txt" file.
I'm happy to see your blind hatred prevents you from looking at the evidence. Reinforces my low opinion of you further. NOAA still uses 1500 weather stations but hey don't let a little thing like a fact bother you.
You deniers produce no evidence!!! You maintain no land based temperature stations. You bitch about poorly sited stations and when the stations are removed you bitch about removing stations. You cry like babies that the data from poorly sited stations should not be included in the data sets, and when it is removed from the data sets you whine that the data sets are being adjusted.

Again, why don't you deniers set up your own temperature stations and publish your own data?????????????????????

http://www.ncdc.noaa.gov/oa/climate/research/Peterson-Vose-1997.pdf

3. Duplicate elimination

A time series for a given station can frequently be
obtained from more than one source. For example,
data for Tombouctou, Mali, were available in six different
source datasets. When “merging” data from
multiple sources, it is important to identify these duplicate
time series because 1) the inclusion of multiple
versions of the same station creates biases in areally
averaged temperature analyses, and 2) the same station
may have different periods of record in different
datasets; merging the two versions can create longer
time series.

The goal of duplicate station elimination is to reduce
a large set of n time series (many of which are
identical) to a much smaller set of m groups of time
series that are unique. In the case of maximum and
minimum temperature, 8000 source dataset time series
were reduced to 4964 unique time series. This was
accomplished in the following fashion. First, the data
for every station were compared with the data for every
other station. This naturally started with stations
whose metadata indicated they were in approximately
the same location. Similarity was assessed by computing
the total number of months of identical data as
well as the percentage of months of identical data.
Maximum–minimum temperature time series were
considered duplicates of the same station if they shared
the same monthly value at least 90% of the time, with
at least 12 months of data being identical and no more
than 12 being different. This process identified the
duplicates, which were then merged to form time series
with longer periods of record after a manual inspection
of the metadata (to avoid misconcatenations).

This process was then repeated on the merged dataset
without the initial metadata considerations so every
time series was compared to all the other time series
in the database. Similarity of time series in this step
was judged by computing the length of the longest run
of identical values.

Cases where the time series were determined to be
duplicates of the same station but the metadata indicated
they were not the same station were examined
carefully and a subjective decision was made. This
assessment provided additional quality control of station
locations and the integrity of their data. For example,
a mean temperature time series for Thamud,
Yemen, had 25 yr (1956–81) of monthly values that
were exactly identical to the mean temperature data
from Kuwait International Airport (12° farther north).
Needless to say, one of these time series was in error.
As with most of these problems, determining which
time series was erroneous was fairly easy given the
data, metadata, knowledge about the individual data
sources, duplicate data, and other climatological information
available.

The procedure for duplicate elimination with mean
temperature was more complex. The first 10 000 duplicates
(out of 30 000+ source time series) were identified
using the same methods applied to the maximum
and minimum temperature datasets. Unfortunately,
because monthly mean temperature has been computed
at least 101 different ways (Griffiths 1997), digital
comparisons could not be used to identify the remaining
duplicates. Indeed, the differences between
two different methods of calculating mean temperature
at a particular station can be greater than the temperature
difference from two neighboring stations.
Therefore, an intense scrutiny of associated metadata
was conducted. Probable duplicates were assigned the
same station number but, unlike the previous cases,
not merged because the actual data were not exactly
identical (although they were quite similar). As a result,
the GHCN version 2 mean temperature dataset
contains multiple versions of many stations. For the
Tombouctou example, the six source time series were
merged to create four different but similar time series
for the same station (see Fig. 1).

Preserving the multiple duplicates provides some
distinct benefits. It guarantees no concatenation errors.
Adding the recent data from one time series to the end
of a different time series can cause discontinuities,
unless the mean temperature was calculated the same
way for both time series. It also preserves all possible
information for the station. When two different values
are given for the same station–year–month, it is often
impossible for the dataset compiler to determine which
is correct. Indeed, both may be correct given the different
methods used to calculate mean temperature.
Unfortunately, preserving the duplicates may cause
some difficulty for users familiar with only one “correct”
mean monthly temperature value at a station.
There are many different ways to use data from duplicates.
All have advantages and disadvantages. One
can use the single duplicate with the most data for the
period of interest; use the longest time series and fill
in missing points using the duplicates; average all data
points for that station–year–month to create a mean
time series; or combine the information in more complicated
ways, such as averaging the first difference
(FDyear 1 = Tyear 2 - Tyear 1) time series of the duplicates
and creating a new time series from the average first
difference series. Which technique is the best depends
on the type of analysis being performed.


Because simpleton the PEOPLE of the United States have allready paid for them. the alarmist activist "scientists" are the ones whos task it is to moniter them properly. They aren't. So just piss off and live in your stupid little hole. I'm done with you. You are as truthful as truthiness is. What a waste of skin.
 
Poor, poor Walleyes. Cannot make a logical arguement. Just blame all them thar librul pointy headed scientists. Everybody knows them idjits don't know Jack!

But the lists still remain the same.
 
Poor, poor Walleyes. Cannot make a logical arguement. Just blame all them thar librul pointy headed scientists. Everybody knows them idjits don't know Jack!

But the lists still remain the same.


olfraud you are of the same ilk as edthemoron (thanks DiveCon so apropo), you wouldn't know a good scientific experiment if it bit you on the ass. You can crawl back into your hole as well. You're just boring now, and I dislike boring boorish people.
 
edthecynic is partially right. I don't believe that temp readings from bad sites would make a significant difference, and I don't think that shrinking the number of stations would either.

there are two areas that I do think have made a significant difference. the first is in the corrections. Hansen's crew have tortured the numbers, and in a biased way so that past temps have gone down and recent temps have gone up. the second way is the fashionable trend for infilling temps in places that have not been measured, at least up to 1000 kilometers away, and sometimes those infills affect the next vacant grid. the statistical methods used for both corrections and infills are poorly coded and difficult to examine and test. just look at the recent debacle over Antarctica.

the other side of this whole data set problem is whether the beaurocracy looking after global warming issues is competent and dedicated to providing top class data. there are less than 10,000 stations to make sure are working right. the amazing amount of mistakes that have been made are very discouraging. stations lost even though they are still recording and reporting but the name was changed and no longer recognized. GPS positions mistakenly putting the station halfway around the world, or moved 500m into a lake thereby turning an urban staion into a rural one (they use night time illumination to designate). there are hundreds of these mistakes. GISS gets a lot of money to run their temp data site but they don't seem to care about making sure the readings are right, they just want to get the trends to match the computer models predictions.
 
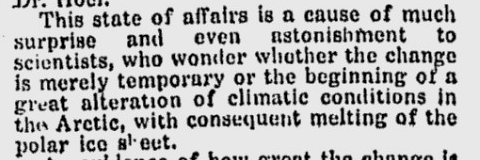
So who is torturing the Arctic Ice, the alpine glaciers?

I assume it is Mother Nature who occasionally warms the Arctic, or increases/decreases the flow of the frozen rivers known as glaciers. Do you think otherwise?

screenhunter_213-feb-23-14-32.gif

screenhunter_194-feb-23-08-26.gif

...
screenhunter_202-feb-23-08-33.gif


the end of the world didnt come in 1922, its not coming in 2011 either.
 
Global warming is happening. Period.
Those who choose to laugh it off won't be laughing soon enough.
 
that is a complete load of crap from the whackos at wuwt who have no credibility at all. If they dropped 6,00 stations there would be no stations. Only duplicate stations were eliminated because of bush ii budget cuts!!! Why don't you deniers fund the reopening of the duplicate sties???? Oh that's right, you know they're duplicates and if you opened them you would only confirm hansen's data. Much better for deniers to make up lies.

Btw, they checked to see if there was a bias from poorly sited stations after you deniers whined about them and they found the bias was for mostly cooler readings. So were deniers happy when the poorly sited stations were removed from the data sets? Hell no, they then condemned hansen for correcting the data and posting adjusted charts with the poorly sited stations removed. Noaa make all this info freely available to all, including you deniers, but deniers prefer to ignore it.

the ushcn version 2 serial monthly dataset

station siting and u.s. Surface temperature trends
recent photographic documentation of poor siting conditions at stations in the ushcn has led to questions regarding the reliability of surface temperature trends over the conterminous u.s. (conus). to evaluate the potential impact of poor siting/instrument exposure on conus temperatures, menne et al. (2010) compared trends derived from poor and well-sited ushcn stations using both unadjusted and bias-adjusted data. results indicate that there is a mean bias associated with poor exposure sites relative to good exposure sites in the unadjusted ushcn version 2 data; however, this bias is consistent with previously documented changes associated with the widespread conversion to electronic sensors in the ushcn during the last 25 years (see e.g., menne et al. 2009). Moreover, the sign of the bias is counterintuitive to photographic documentation of poor exposure because associated instrument changes have led to an artificial negative (“cool”) bias in maximum temperatures and only a slight positive (“warm”) bias in minimum temperatures.

adjustments applied to ushcn version 2 data largely account for the impact of instrument and siting changes, although a small overall residual negative (“cool”) bias appears to remain in the adjusted ushcn version 2 conus average maximum temperature. Nevertheless, the adjusted ushcn conus temperatures are well aligned with recent measurements from the u.s. Climate reference network (uscrn). This network was designed with the highest standards for climate monitoring and has none of the siting and instrument exposure problems present in ushcn. The close correspondence in nationally averaged temperature from these two networks is further evidence that the adjusted ushcn data provide an accurate measure of the u.s. Temperature.

The menne et al. (2010) results underscore the need to consider all changes in observation practice when determining the impacts of siting irregularities. Further, the influence of non-standard siting on temperature trends can only be quantified through an analysis of the data which do not indicate that the conus average temperature trends are inflated due to poor station siting.

Four sets of uschn stations were used in the menne et al. (2010) analysis. Set 1 includes stations identified as having good siting by the volunteers at surfacestations.org. Set 2 is a subset of set 1 consisting of the set 1 stations whose ratings are in general agreement with an independent assessment by noaa’s national weather service. Set 3 are those stations with moderate to poor siting ratings according to surfacestations.org. Set 4 is a subset of set 3 consisting of the set 3 stations whose ratings are in agreement with an independent assessment by noaa’s national weather service. for further information, please see menne et al. (2010). The set of maximum minimum temperature sensor (mmts) stations and cotton region shelter (stevenson screen) sites used in menne et al. (2010) are also available (see the "readme.txt" file as described below for a description of the station list format). Access to the unadjusted, time of observation adjusted, and fully adjusted ushcn version 2 temperature data is described below.

data access
u.s. Hcn version 2 monthly data are available via ftp at ftp://ftp.ncdc.noaa.gov/pub/data/ushcn/v2/monthly/. Please see the "readme.txt" file in this directory for information on downloading and reading u.s hcn v2 data. Version control information is provided in the "status.txt" file.
i'm happy to see your blind hatred prevents you from looking at the evidence. Reinforces my low opinion of you further. Noaa still uses 1500 weather stations but hey don't let a little thing like a fact bother you.
you deniers produce no evidence!!! You maintain no land based temperature stations. You bitch about poorly sited stations and when the stations are removed you bitch about removing stations. You cry like babies that the data from poorly sited stations should not be included in the data sets, and when it is removed from the data sets you whine that the data sets are being adjusted.

Again, why don't you deniers set up your own temperature stations and publish your own data?????????????????????

http://www.ncdc.noaa.gov/oa/climate/research/peterson-vose-1997.pdf

3. Duplicate elimination

a time series for a given station can frequently be
obtained from more than one source. For example,
data for tombouctou, mali, were available in six different
source datasets. When “merging” data from
multiple sources, it is important to identify these duplicate
time series because 1) the inclusion of multiple
versions of the same station creates biases in areally
averaged temperature analyses, and 2) the same station
may have different periods of record in different
datasets; merging the two versions can create longer
time series.

The goal of duplicate station elimination is to reduce
a large set of n time series (many of which are
identical) to a much smaller set of m groups of time
series that are unique. In the case of maximum and
minimum temperature, 8000 source dataset time series
were reduced to 4964 unique time series. This was
accomplished in the following fashion. First, the data
for every station were compared with the data for every
other station. This naturally started with stations
whose metadata indicated they were in approximately
the same location. Similarity was assessed by computing
the total number of months of identical data as
well as the percentage of months of identical data.
Maximum–minimum temperature time series were
considered duplicates of the same station if they shared
the same monthly value at least 90% of the time, with
at least 12 months of data being identical and no more
than 12 being different. This process identified the
duplicates, which were then merged to form time series
with longer periods of record after a manual inspection
of the metadata (to avoid misconcatenations).

This process was then repeated on the merged dataset
without the initial metadata considerations so every
time series was compared to all the other time series
in the database. Similarity of time series in this step
was judged by computing the length of the longest run
of identical values.

Cases where the time series were determined to be
duplicates of the same station but the metadata indicated
they were not the same station were examined
carefully and a subjective decision was made. This
assessment provided additional quality control of station
locations and the integrity of their data. For example,
a mean temperature time series for thamud,
yemen, had 25 yr (1956–81) of monthly values that
were exactly identical to the mean temperature data
from kuwait international airport (12° farther north).
Needless to say, one of these time series was in error.
As with most of these problems, determining which
time series was erroneous was fairly easy given the
data, metadata, knowledge about the individual data
sources, duplicate data, and other climatological information
available.

The procedure for duplicate elimination with mean
temperature was more complex. The first 10 000 duplicates
(out of 30 000+ source time series) were identified
using the same methods applied to the maximum
and minimum temperature datasets. Unfortunately,
because monthly mean temperature has been computed
at least 101 different ways (griffiths 1997), digital
comparisons could not be used to identify the remaining
duplicates. Indeed, the differences between
two different methods of calculating mean temperature
at a particular station can be greater than the temperature
difference from two neighboring stations.
Therefore, an intense scrutiny of associated metadata
was conducted. Probable duplicates were assigned the
same station number but, unlike the previous cases,
not merged because the actual data were not exactly
identical (although they were quite similar). As a result,
the ghcn version 2 mean temperature dataset
contains multiple versions of many stations. For the
tombouctou example, the six source time series were
merged to create four different but similar time series
for the same station (see fig. 1).

Preserving the multiple duplicates provides some
distinct benefits. It guarantees no concatenation errors.
Adding the recent data from one time series to the end
of a different time series can cause discontinuities,
unless the mean temperature was calculated the same
way for both time series. It also preserves all possible
information for the station. When two different values
are given for the same station–year–month, it is often
impossible for the dataset compiler to determine which
is correct. Indeed, both may be correct given the different
methods used to calculate mean temperature.
Unfortunately, preserving the duplicates may cause
some difficulty for users familiar with only one “correct”
mean monthly temperature value at a station.
There are many different ways to use data from duplicates.
All have advantages and disadvantages. One
can use the single duplicate with the most data for the
period of interest; use the longest time series and fill
in missing points using the duplicates; average all data
points for that station–year–month to create a mean
time series; or combine the information in more complicated
ways, such as averaging the first difference
(fdyear 1 = tyear 2 - tyear 1) time series of the duplicates
and creating a new time series from the average first
difference series. Which technique is the best depends
on the type of analysis being performed.

s w a g
 
Global warming is happening. Period.
Those who choose to laugh it off won't be laughing soon enough.


Yes it is. It began 12,000 years ago. What started it then? What kept it going? Why was it 6 degrees warmer than the current time 2000 years ago during the Roman Warming Period? Why was it warmer 1000 years ago during the Medieval Warming Period? Why do you think there is any difference between the warming now and the warming that happened back then?

These are all facts. These are also facts that the alarmists don't want you to kno about because it interferes with their claims that this is the warmest the planet has ever been, which is patently ridiculous. Mann would not try to erase well known history like the MWP without reason don't you think?

BTW, get used to the cold because the planet has entered into yet another cooling phase and it will be colder for at least the next 20 years.

Per usual, westy wants us to believe that just because something had one cause in the past that it couldn't have another cause today. That's just not logical and throws a bad light on his sources. If one can't be logical in one's posts, how can we trust that his chosen sources don't have the same lack of logic?
and you think its logical that something that happened in the past is not whats happening now?
 
Damn, and alll this very long time I was under the impression that Gore, the bore, was speaking the truth..........................:lol::lol::lol: Right.................
 

Forum List

Back
Top