Inhofe Exposes Global Warming Hoax

Questions about the "accuracy" of the UAH data began in 2000, and Christy and Spencer refused to check their "method." That simple algebraic correction was using the correct sign for diurnal satellite drift. We're supposed to believe that the formost experts on satellite data were too stupid to know what sign to use and as deniers just happened to GUESS the sign that showed global cooling.

And even though Mears & Wentz showed them their algebraic error in 2005, Christy and Spencer didn't get around to correcting it till 2007.


OK, so now we are getting somewhere. do you have some links that show it took two years to correct the mistake, and some that hint that it was a fraud? I looked pretty hard and didnt find anything like that but if it is true I would like to know about it.
 
The baseline is the 30 year average for that particular meter!!!!
Geeeeezzzz you guys are THICK!
No, thicker person, there is no baseline for the actual instruments because Hansen keeps "adjusting" them. Try to keep up with what;s being discussed instead of blathering on about your particular bit of drivel. We don't KNOW what the measurements are because they keep getting changed. Got it? That's the issue. If the instruments keep getting adjusted after the fact you don't know what the hell the readings are do you smart guy.
Bullshit!


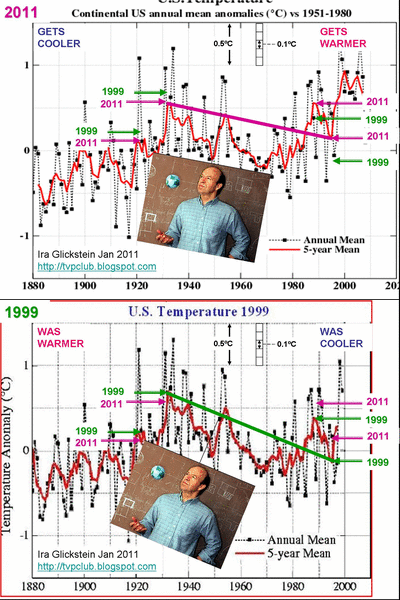
gw-us-1999-2011-hansen.gif


Hansen and his juggling act
 
Questions about the "accuracy" of the UAH data began in 2000, and Christy and Spencer refused to check their "method." That simple algebraic correction was using the correct sign for diurnal satellite drift. We're supposed to believe that the formost experts on satellite data were too stupid to know what sign to use and as deniers just happened to GUESS the sign that showed global cooling.

And even though Mears & Wentz showed them their algebraic error in 2005, Christy and Spencer didn't get around to correcting it till 2007.


OK, so now we are getting somewhere. do you have some links that show it took two years to correct the mistake, and some that hint that it was a fraud? I looked pretty hard and didnt find anything like that but if it is true I would like to know about it.
As I said, their error in diurnal satellite was first published in 2000, but they refused to check their calculations. And the only way it is not fraud is if these "experts" are too stupid to know what sign to use to correct for diurnal satellite drift. If you are trying to claim that they actually are that stupid, then what are they doing handling any data???
 
Questions about the "accuracy" of the UAH data began in 2000, and Christy and Spencer refused to check their "method." That simple algebraic correction was using the correct sign for diurnal satellite drift. We're supposed to believe that the formost experts on satellite data were too stupid to know what sign to use and as deniers just happened to GUESS the sign that showed global cooling.

And even though Mears & Wentz showed them their algebraic error in 2005, Christy and Spencer didn't get around to correcting it till 2007.


OK, so now we are getting somewhere. do you have some links that show it took two years to correct the mistake, and some that hint that it was a fraud? I looked pretty hard and didnt find anything like that but if it is true I would like to know about it.
As I said, their error in diurnal satellite was first published in 2000, but they refused to check their calculations. And the only way it is not fraud is if these "experts" are too stupid to know what sign to use to correct for diurnal satellite drift. If you are trying to claim that they actually are that stupid, then what are they doing handling any data???


I am politely asking you to back up your accusations with some semblace of evidence. show me where they were told to correct an error and they failed to do it in a timely fashion.
I've done it a dozen times in a dozen other threads and you still will not admit it's been posted.

This was published in 2000. Now you show where Christy and Spencer corrected their diurnal satellite drift errors in a timely manor after this paper showed how to do it!

GEOPHYSICAL RESEARCH LETTERS, VOL. 27, NO. 21, PP. 3517-3520, 2000
doi:10.1029/2000GL011719
Global warming: Evidence from satellite observations
C. Prabhakara
NASA/Goddard Space Flight Center, Greenbelt, MD
R. Iacovazzi Jr.
Raytheon ITSS, Lanham, MD
J.‐M. Yoo
EWHA Womans University, Seoul, South Korea
G. Dalu
CNR, Cagliari, Italy
Observations made in Channel 2 (53.74 GHz) of the Microwave Sounding Unit (MSU) radiometer, flown on‐board sequential, sun‐synchronous, polar‐orbiting NOAA operational satellites, indicate that the mean temperature of the atmosphere over the globe increased during the period 1980 to 1999. In this study, we have minimized systematic errors in the time series introduced by satellite orbital drift in an objective manner. This is done with the help of the onboard warm‐blackbody temperature, which is used in the calibration of the MSU radiometer. The corrected MSU Channel 2 observations of the NOAA satellite series reveal that the vertically‐weighted global‐mean temperature of the atmosphere, with a peak weight near the mid troposphere, warmed at the rate of 0.13±0.05 Kdecade−1 during 1980 to 1999.


the abstract doesnt mention S&C, and the article is behind a paywall. are you sure it calls S&C frauds? have you actually read the article?

the satellite wiki page and IPCC talk about many corrections and adjustments made over the years for various things and the calibration between different types and vintages of satellites but I can't find anything that disparages S&C. are you sure you have your facts straight?

or are you just saying that a different group did their own analysis of satellite data and mentioned satellite drift therefor S&C must have lied about their work? I think every group gets slightly different numbers because converting satellite data into temperature is complicated. as I said before, RSS has substantially dropped its numbers for the last ten years putting it very close to UAH. should we look to see if Mears et al were fudging their data? were they fraudulent too in your mind?
 
I snipped a comment from Climate Audit 2006 by the great guest poster on WUWT, Willis Eschenbach-

And in #26, you say

Re #20: One “small correction”? *snork* A couple of errors with pretty large consequences, as I recall. S+C’s stuff got a lot of attention mainly because they sought to portray their findings as an anti-AGW argument, underlined that stance by aligning themselves with the ExxonMobil-funded FUDtanks, and wound things up with the aforementioned bait-and-switch. Consider by way of contrast the treatment by all sides of the ocean cooling findings of Lyman et al.
Setting aside your various ad-homs, I’d like to make a couple of points about Spencer and Christy:

1) They have always been totally open about their procedures, their data, and their errors.

2) All but one of the errors they identified themselves, and duly reported them.

3) When the RSS folks found one error, they acknowledged it, and adjusted their dataset accordingly.

“An artifact of the diurnal correction applied to LT
has been discovered by Carl Mears and Frank Wentz
(Remote Sensing Systems). This artifact contributed an
error term in certain types of diurnal cycles, most
noteably in the tropics. We have applied a new diurnal
correction based on 3 AMSU instruments and call the dataset
v5.2. This artifact does not appear in MT or LS. The new
global trend from Dec 1978 to July 2005 is +0.123 C/decade,
or +0.035 C/decade warmer than v5.1. This particular
error is within the published margin of error for LT of
+/- 0.05 C/decade (Christy et al. 2003). We thank Carl and
Frank for digging into our procedure and discovering this
error. All radiosonde comparisons have been rerun and the
agreement is still exceptionally good. There was virtually
no impact of this error outside of the tropics.”
Note that, far from “pretty large consequences”, this is 0.035°C/decade. Also, note that they thanked RSS for finding the error. That’s how real science works, Steve, not the Piltdown Mann style …

Here’s another:

Update 8 April 2002 **********************

Roy Spencer and I are in the process of upgrading
the MSU/AMSU data processing to include a new
non-linear approximation of the diurnal cycle
correction (currently the approximation is linear).
In preliminary results, the effect is very small,
well within the estimated 95% C.I. of +/- 0.06
C/decade. In the products released today, some
minor changes have been included (though not the
new non-linear diurnal adjustment). The 2LT trend
is +0.053 C/decade through Mar 2002. The difference
in today’s release vs. last month’s is a slight
warming of monthly data after 1998. Essentially,
this release corrects an error in the linear diurnal
adjustment and produces better
agreement between the MSU on NOAA-14 and the AMSU
on NOAA-15. The single largest global anomaly
impact is a relative increase of +0.041 (April 2001)
while most are within 0.02 of the previous values.
The net change in the overall trend was toward a more
positive value by +0.012 C/decade. Again, this is
still an interim change, and we anticipate a final
version (“E” or “5.0″) next month.
Now, you know what, Steve? The discovery and correction of these errors do not make me trust the S+C data less, they make me trust it more. Why? Because it’s been under the microscope, both by the creators and the detractors, and every error found so far has been fixed. That process leads me to more confidence in their results than, say, the Phil Jones dataset that he won’t release because he’s terrified that someone will find an error …
 
Yet another environmental expert who doesn't know how anomalies work.

Let's say the meter is off by 5 degrees. Every reading will be off by the same 5 degrees. The 30 year average will be off by the same 5 degrees. The anomaly will be calculated by comparing the current reading, off by 5 degrees, to the 30 year average, also off by 5 degrees, and the DIFFERENCE is recorded as the anomaly. If the DIFFERENCE is positive the TREND is up and if the DIFFERENCE is minus the TREND is down. Anomalies accurately show the direction of the trend no matter how inaccurate the meter is. Anomalies only show trends, they do not give the actual temperature.

I'm not quite sure about this specific equipment, or what "anomaly" they have. I do, however, know something about instrumentation. The problem with instrumentation is that it's designed to work a certain way, therefore, people assume that it is working correctly and how it's designed to work. On top of that, they also assume that an instrument will only have one "anomaly" at a time. Anyone involved in instrumentation knows that one anomaly is usually linked to another. Are we sure that if the instrument was off 5 degrees, that this was the only anomaly caused by a certain problem? I watch trends that are created by the monitoring of highly sensitive transmittors and radars. I work with level transmittors, temperature transmitters, PH transmittors, pressure transmittors and turbidity transmittors every day. There's one thing I've learned about these transmittors and this expensive equipment. You CANNOT trust them.
The meter being off by 5 degrees is NOT the anomaly!!!!!!!!!!!!!!!!!!!!!

An anomaly is the deviation from the 30 year average for that meter.

You're assuming that this meter is only off by 5 degrees and that being off by 5 degrees is the only problem it had. How do you know? Auto manufactures mass manufacture meters and transmittors in vehicles and the damn things don't work the way they're supposed to. PH meters gradually drift and rise over time even though the real PH doesn't. I'm just saying that you're assuming that this equipment (or any equipment) is etxtremely precise and works exactly how it's supposed to work.
 
That's my point. There's no zero point. If we had a baseline we could at least derive some useful information.
The baseline is the 30 year average for that particular meter!!!!
Geeeeezzzz you guys are THICK!


No, thicker person, there is no baseline for the actual instruments because Hansen keeps "adjusting" them. Try to keep up with what;s being discussed instead of blathering on about your particular bit of drivel. We don't KNOW what the measurements are because they keep getting changed. Got it? That's the issue. If the instruments keep getting adjusted after the fact you don't know what the hell the readings are do you smart guy.

That's correct, you can't have an "average" if the meter is constantly being adjusted and/or calibrated.
 
I snipped a comment from Climate Audit 2006 by the great guest poster on WUWT, Willis Eschenbach-

And in #26, you say

Re #20: One “small correction”? *snork* A couple of errors with pretty large consequences, as I recall. S+C’s stuff got a lot of attention mainly because they sought to portray their findings as an anti-AGW argument, underlined that stance by aligning themselves with the ExxonMobil-funded FUDtanks, and wound things up with the aforementioned bait-and-switch. Consider by way of contrast the treatment by all sides of the ocean cooling findings of Lyman et al.
Setting aside your various ad-homs, I’d like to make a couple of points about Spencer and Christy:

1) They have always been totally open about their procedures, their data, and their errors.

2) All but one of the errors they identified themselves, and duly reported them.

3) When the RSS folks found one error, they acknowledged it, and adjusted their dataset accordingly.

“An artifact of the diurnal correction applied to LT
has been discovered by Carl Mears and Frank Wentz
(Remote Sensing Systems). This artifact contributed an
error term in certain types of diurnal cycles, most
noteably in the tropics. We have applied a new diurnal
correction based on 3 AMSU instruments and call the dataset
v5.2. This artifact does not appear in MT or LS. The new
global trend from Dec 1978 to July 2005 is +0.123 C/decade,
or +0.035 C/decade warmer than v5.1. This particular
error is within the published margin of error for LT of
+/- 0.05 C/decade
(Christy et al. 2003). We thank Carl and
Frank for digging into our procedure and discovering this
error. All radiosonde comparisons have been rerun and the
agreement is still exceptionally good. There was virtually
no impact of this error outside of the tropics.”
Note that, far from “pretty large consequences”, this is 0.035°C/decade. Also, note that they thanked RSS for finding the error. That’s how real science works, Steve, not the Piltdown Mann style …

Here’s another:

Update 8 April 2002 **********************

Roy Spencer and I are in the process of upgrading
the MSU/AMSU data processing to include a new
non-linear approximation of the diurnal cycle
correction (currently the approximation is linear).
In preliminary results, the effect is very small,
well within the estimated 95% C.I. of +/- 0.06
C/decade. In the products released today, some
minor changes have been included (though not the
new non-linear diurnal adjustment). The 2LT trend
is +0.053 C/decade through Mar 2002. The difference
in today’s release vs. last month’s
is a slight
warming of monthly data after 1998. Essentially,
this release corrects an error in the linear diurnal
adjustment and produces better
agreement between the MSU on NOAA-14 and the AMSU
on NOAA-15. The single largest global anomaly
impact is a relative increase of +0.041 (April 2001)
while most are within 0.02 of the previous values.

The net change in the overall trend was toward a more
positive value by +0.012 C/decade. Again, this is
still an interim change, and we anticipate a final
version (“E” or “5.0″) next month.
Now, you know what, Steve? The discovery and correction of these errors do not make me trust the S+C data less, they make me trust it more. Why? Because it’s been under the microscope, both by the creators and the detractors, and every error found so far has been fixed. That process leads me to more confidence in their results than, say, the Phil Jones dataset that he won’t release because he’s terrified that someone will find an error …
Well, of course the whacko denier site WUWT is going to downplay the UAH error, and trust the source of their fudged data even more. Fudged data is all deniers have. But nothing in your two snippets is true. Spencer and Christy would only correct their errors when other people exposed them.

Before they were first forced to correct their data they were claiming a COOLING of -0.05 C per decade in 1998. After several corrections of several errors in their data it was up to +0.123 C per decade by 2005, a hell of a lot bigger difference then WUWT's claim of only a +0.035 C per decade correction. If you notice, your snippets just pick each individual correction and compare it only to the previous data immediately before the new correction to make the errors seem as small as possible, and not the sum of all the corrections which is significant. They can't even be truthful about their corrections!!!
 
I'm not quite sure about this specific equipment, or what "anomaly" they have. I do, however, know something about instrumentation. The problem with instrumentation is that it's designed to work a certain way, therefore, people assume that it is working correctly and how it's designed to work. On top of that, they also assume that an instrument will only have one "anomaly" at a time. Anyone involved in instrumentation knows that one anomaly is usually linked to another. Are we sure that if the instrument was off 5 degrees, that this was the only anomaly caused by a certain problem? I watch trends that are created by the monitoring of highly sensitive transmittors and radars. I work with level transmittors, temperature transmitters, PH transmittors, pressure transmittors and turbidity transmittors every day. There's one thing I've learned about these transmittors and this expensive equipment. You CANNOT trust them.
The meter being off by 5 degrees is NOT the anomaly!!!!!!!!!!!!!!!!!!!!!

An anomaly is the deviation from the 30 year average for that meter.

You're assuming that this meter is only off by 5 degrees and that being off by 5 degrees is the only problem it had. How do you know? Auto manufactures mass manufacture meters and transmittors in vehicles and the damn things don't work the way they're supposed to. PH meters gradually drift and rise over time even though the real PH doesn't. I'm just saying that you're assuming that this equipment (or any equipment) is etxtremely precise and works exactly how it's supposed to work.
I'm assuming nothing, you are. I picked 5 degrees as an arbitrary example. There could be 100 things wrong with the meter, it doesn't matter. The point is that the 30 year average will also contain all 100 problems and the trend shown by the anomaly will still be accurate.
 
Why even bother responding to the loony toon chicken littles? They seem to believe their argument has credibility if you talk to them, when a junior high science text can debunk them.
 
Last edited:
The baseline is the 30 year average for that particular meter!!!!
Geeeeezzzz you guys are THICK!


No, thicker person, there is no baseline for the actual instruments because Hansen keeps "adjusting" them. Try to keep up with what;s being discussed instead of blathering on about your particular bit of drivel. We don't KNOW what the measurements are because they keep getting changed. Got it? That's the issue. If the instruments keep getting adjusted after the fact you don't know what the hell the readings are do you smart guy.

That's correct, you can't have an "average" if the meter is constantly being adjusted and/or calibrated.


Exactly. Without a unequivocal baseline you have nothing. Hansens numbers are worthless because he has screwed with the data sets for so long and so frequently that no one has a clue what is correct. The antithesis of science. Science is about precision and Hansen destroyed whatever precision there was with the GISSTEMP record. He should be prosecuted for that travesty alone.
 
I snipped a comment from Climate Audit 2006 by the great guest poster on WUWT, Willis Eschenbach-

And in #26, you say

Re #20: One “small correction”? *snork* A couple of errors with pretty large consequences, as I recall. S+C’s stuff got a lot of attention mainly because they sought to portray their findings as an anti-AGW argument, underlined that stance by aligning themselves with the ExxonMobil-funded FUDtanks, and wound things up with the aforementioned bait-and-switch. Consider by way of contrast the treatment by all sides of the ocean cooling findings of Lyman et al.
Setting aside your various ad-homs, I’d like to make a couple of points about Spencer and Christy:

1) They have always been totally open about their procedures, their data, and their errors.

2) All but one of the errors they identified themselves, and duly reported them.

3) When the RSS folks found one error, they acknowledged it, and adjusted their dataset accordingly.

“An artifact of the diurnal correction applied to LT
has been discovered by Carl Mears and Frank Wentz
(Remote Sensing Systems). This artifact contributed an
error term in certain types of diurnal cycles, most
noteably in the tropics. We have applied a new diurnal
correction based on 3 AMSU instruments and call the dataset
v5.2. This artifact does not appear in MT or LS. The new
global trend from Dec 1978 to July 2005 is +0.123 C/decade,
or +0.035 C/decade warmer than v5.1. This particular
error is within the published margin of error for LT of
+/- 0.05 C/decade
(Christy et al. 2003). We thank Carl and
Frank for digging into our procedure and discovering this
error. All radiosonde comparisons have been rerun and the
agreement is still exceptionally good. There was virtually
no impact of this error outside of the tropics.”
Note that, far from “pretty large consequences”, this is 0.035°C/decade. Also, note that they thanked RSS for finding the error. That’s how real science works, Steve, not the Piltdown Mann style …

Here’s another:

Update 8 April 2002 **********************

Roy Spencer and I are in the process of upgrading
the MSU/AMSU data processing to include a new
non-linear approximation of the diurnal cycle
correction (currently the approximation is linear).
In preliminary results, the effect is very small,
well within the estimated 95% C.I. of +/- 0.06
C/decade. In the products released today, some
minor changes have been included (though not the
new non-linear diurnal adjustment). The 2LT trend
is +0.053 C/decade through Mar 2002. The difference
in today’s release vs. last month’s
is a slight
warming of monthly data after 1998. Essentially,
this release corrects an error in the linear diurnal
adjustment and produces better
agreement between the MSU on NOAA-14 and the AMSU
on NOAA-15. The single largest global anomaly
impact is a relative increase of +0.041 (April 2001)
while most are within 0.02 of the previous values.

The net change in the overall trend was toward a more
positive value by +0.012 C/decade. Again, this is
still an interim change, and we anticipate a final
version (“E” or “5.0″) next month.
Now, you know what, Steve? The discovery and correction of these errors do not make me trust the S+C data less, they make me trust it more. Why? Because it’s been under the microscope, both by the creators and the detractors, and every error found so far has been fixed. That process leads me to more confidence in their results than, say, the Phil Jones dataset that he won’t release because he’s terrified that someone will find an error …
Well, of course the whacko denier site WUWT is going to downplay the UAH error, and trust the source of their fudged data even more. Fudged data is all deniers have. But nothing in your two snippets is true. Spencer and Christy would only correct their errors when other people exposed them.

Before they were first forced to correct their data they were claiming a COOLING of -0.05 C per decade in 1998. After several corrections of several errors in their data it was up to +0.123 C per decade by 2005, a hell of a lot bigger difference then WUWT's claim of only a +0.035 C per decade correction. If you notice, your snippets just pick each individual correction and compare it only to the previous data immediately before the new correction to make the errors seem as small as possible, and not the sum of all the corrections which is significant. They can't even be truthful about their corrections!!!


That "whacko" denier sight frequently has opposing guest posters if you would ever bother to look. WUWT is far more interested in good science than being a "denier" site. You're a broken record pal, try looking at the science some day instead of parroting your fellow travellers.
 
The meter being off by 5 degrees is NOT the anomaly!!!!!!!!!!!!!!!!!!!!!

An anomaly is the deviation from the 30 year average for that meter.

You're assuming that this meter is only off by 5 degrees and that being off by 5 degrees is the only problem it had. How do you know? Auto manufactures mass manufacture meters and transmittors in vehicles and the damn things don't work the way they're supposed to. PH meters gradually drift and rise over time even though the real PH doesn't. I'm just saying that you're assuming that this equipment (or any equipment) is etxtremely precise and works exactly how it's supposed to work.
I'm assuming nothing, you are. I picked 5 degrees as an arbitrary example. There could be 100 things wrong with the meter, it doesn't matter. The point is that the 30 year average will also contain all 100 problems and the trend shown by the anomaly will still be accurate.


You can't get through your pointy little head that we don't know WHAT the damn readings are because Hansen keeps changing them. Can't you get that? Are you so wrapped around the axle of alarmism that you can't grasp a simple concept? Hansen has screwed it up so bad you can put ANY DAMNED NUMBER IN YOU WANT! It doesn't matter because the record is so screwed up there is NO WAY TO KNOW WHAT WAS CORRECT. Go it?
 
Why even bother responding to the loony toon chicken littles? They seem to believe their argument has credibility if you talk to them, when a junior high science text can debunk them.


Man, ain't that the truth!
 
The meter being off by 5 degrees is NOT the anomaly!!!!!!!!!!!!!!!!!!!!!

An anomaly is the deviation from the 30 year average for that meter.

You're assuming that this meter is only off by 5 degrees and that being off by 5 degrees is the only problem it had. How do you know? Auto manufactures mass manufacture meters and transmittors in vehicles and the damn things don't work the way they're supposed to. PH meters gradually drift and rise over time even though the real PH doesn't. I'm just saying that you're assuming that this equipment (or any equipment) is etxtremely precise and works exactly how it's supposed to work.
I'm assuming nothing, you are. I picked 5 degrees as an arbitrary example. There could be 100 things wrong with the meter, it doesn't matter. The point is that the 30 year average will also contain all 100 problems and the trend shown by the anomaly will still be accurate.

Now you're assuming that the 100 problems experienced 30 years ago are the same 100 problems it experiences now. Maybe it has 99 problems now, and the one less problem it has now changed the entire meter's accuracy. What if there were 100 problems 30 years ago and 130 problems now? IF you were absolutely CERTAIN that the meter had a certain amount of problems, and these were the only problems they experienced, then you could possibly see a reliable trend in the data. I have a big problem with the "average temperature" monitoring. In areas where they have VERY WIDE ranges of temperatures, it makes "average temperatures" much less important than if they were placed in areas with narrow temperature ranges.
 
Logical, that is a graph from Dr. Roy Spencer, the fellow Rush Limpbaugh calls his own scientist. And his data leaves out the worst of the warmng in the Arctic.

You did not answer the questions. If you are stating this data should "change" our lives, then you should be able to tell me if the equipment was within calibration and if it was calibrated, regularly.
That's why they use ANOMALIES. With anomalies calibration is unimportant. But as an expert on the environment you already knew that.

If you are not measuring "ANOMALIES" accurately, you do not have an accurate picture. It is a SWAG.
 
That's why they use ANOMALIES. With anomalies calibration is unimportant. But as an expert on the environment you already knew that.
If the equipment is not correct how do you know the ANOMALIES even exist?
Yet another environmental expert who doesn't know how anomalies work.

Let's say the meter is off by 5 degrees. Every reading will be off by the same 5 degrees. The 30 year average will be off by the same 5 degrees. The anomaly will be calculated by comparing the current reading, off by 5 degrees, to the 30 year average, also off by 5 degrees, and the DIFFERENCE is recorded as the anomaly. If the DIFFERENCE is positive the TREND is up and if the DIFFERENCE is minus the TREND is down. Anomalies accurately show the direction of the trend no matter how inaccurate the meter is. Anomalies only show trends, they do not give the actual temperature.

One of the problems with electronic measurement systems, is that, the "error" is not consistant. In an analog device, that is usually true. With electronics (digital), those signals can vary with temperature, climate conditions, age and wear. Depending on the condition, it can increase or decrease the reading. It cannot be predicted, it cannot be calculated away (because you don't know the error). That is why if you want accuracy, calibration is key.

I don't need to understand everything in the science to understand that the "digital" temperature equipment used is rarely calibrated. For the purpose installed, it just needs to be close. The purpose, hijacked by the "global warming religion" (faith based), those figures are "corrected" based on the agenda of the religion.
 
The baseline is the 30 year average for that particular meter!!!!
Geeeeezzzz you guys are THICK!


No, thicker person, there is no baseline for the actual instruments because Hansen keeps "adjusting" them. Try to keep up with what;s being discussed instead of blathering on about your particular bit of drivel. We don't KNOW what the measurements are because they keep getting changed. Got it? That's the issue. If the instruments keep getting adjusted after the fact you don't know what the hell the readings are do you smart guy.

That's correct, you can't have an "average" if the meter is constantly being adjusted and/or calibrated.


Instrumentation is calibrated to "standards". For temperature that could be as simple as a container of ice water ... the temperature should read exactly 32 degrees F. For boiling ...212 degrees F at sea level. There are calibrated standards to do the same thing. If the meter is not calibrated, there can be quite a bit (comparatively speaking in tenths of degrees) of drift. If your meter is checked periodically and found to be "in tolerance", you can be sure the readings are accurate, usually within hundreds of a degree. If the meter is found out of tolerance, that should be noted and the meter data disregarded and the meter calibrated or replaced. Has this been done?
For most temperature readings in remote sites, a weather station is only checked when information is not being sent (transmitted). The calibration is not checked until it is very obvious the readings are inaccurate. The global warming religion uses these readings without verifying the accuracy.
 

Forum List

Back
Top