Navigation
Install the app
How to install the app on iOS
Follow along with the video below to see how to install our site as a web app on your home screen.
Note: This feature may not be available in some browsers.
More options
You are using an out of date browser. It may not display this or other websites correctly.
You should upgrade or use an alternative browser.
You should upgrade or use an alternative browser.
Greenland Ice Sensitivity
- Thread starter Old Rocks
- Start date
CrusaderFrank
Diamond Member
- May 20, 2009
- 148,629
- 71,936
- 2,330

Leave Greenland Ice ALONE!! It's Sensitive!
CrusaderFrank
Diamond Member
- May 20, 2009
- 148,629
- 71,936
- 2,330
hey! I thought there was a peer reviewed paper out that said that (somewhere) on the eastern seaboard had the fastest rising sea levels in the world. this map doesnt seem to agree with that.

Why does your map hate science? Your map was paid for by Koch Brothers! Denier!
bobgnote
Rookie
- Nov 24, 2008
- 1,258
- 38
- 0
- Banned
- #24
IanCrapforbrains is only a partial dumbshit, who loaded a pretty good graph. Crosstard is a complete fucktard, with no practical applications.
The OTHER THREAD has an OP, where SLR is described, as having a trade current disruption-related effect, between Cape Hatteras and Boston.
You loaded an interesting graphic, Crapforbrains. Congratulations. That being said, you and CrosstardPunk are still too stupid, to offer parts of a study or intelligent comments, for orderly discourse. But that is why you are Crosstard and Crapforbrains, still stupid, acting like dumbfucks, even if you loaded a graphic.
bobgnote
Rookie
- Nov 24, 2008
- 1,258
- 38
- 0
- Banned
- #25
IanCrapforbrains is only a partial dumbshit, who loaded a pretty good graph. Crosstard is a complete fucktard, with no practical applications.
The OTHER THREAD has an OP, where SLR is described, as having a trade current disruption-related effect, between Cape Hatteras and Boston.
You loaded an interesting graphic, Crapforbrains. Congratulations. That being said, you and CrosstardPunk are still too stupid, to offer parts of a study or intelligent comments, for orderly discourse. But that is why you are Crosstard and Crapforbrains, still stupid, acting like dumbfucks, even if you loaded a graphic.
The OTHER THREAD has an OP, where SLR is described, as having a trade current disruption-related effect, between Cape Hatteras and Boston.
You loaded an interesting graphic, Crapforbrains. Congratulations. That being said, you and CrosstardPunk are still too stupid, to offer parts of a study or intelligent comments, for orderly discourse. But that is why you are Crosstard and Crapforbrains, still stupid, acting like dumbfucks, even if you loaded a graphic.
skookerasbil
Platinum Member
IanCrapforbrains is only a partial dumbshit, who loaded a pretty good graph. Crosstard is a complete fucktard, with no practical applications.
The OTHER THREAD has an OP, where SLR is described, as having a trade current disruption-related effect, between Cape Hatteras and Boston.
You loaded an interesting graphic, Crapforbrains. Congratulations. That being said, you and CrosstardPunk are still too stupid, to offer parts of a study or intelligent comments, for orderly discourse. But that is why you are Crosstard and Crapforbrains, still stupid, acting like dumbfucks, even if you loaded a graphic.

but still the fucktards are winning s0n.................
skookerasbil
Platinum Member

4 more months until the SS over a the EPA get mothballed for 2 generations.
Trakar
VIP Member
- Feb 28, 2011
- 1,699
- 74
- 83
I love satellite measurements. they have revolutionized many areas of study.
the difficulty with satellites is to get them properly calibrated and to figure out exactly what they are saying. temp readings have been around for 30 years and are probably pretty reliable. sea level readings have been around for 20 years and may be reliable but do we really know what they are telling us? GRACE gravity readings have been around for 10 years and are incredibly complex to analyze. calibrating GRACE involves making estimates and computer models and then seeing whether the data fit. I wouldnt bet my house on the accuracy of GRACE even if it gives precise results.
let's step back to the satellite altimetry from the last 20 years-

or this one which is more up-to-date
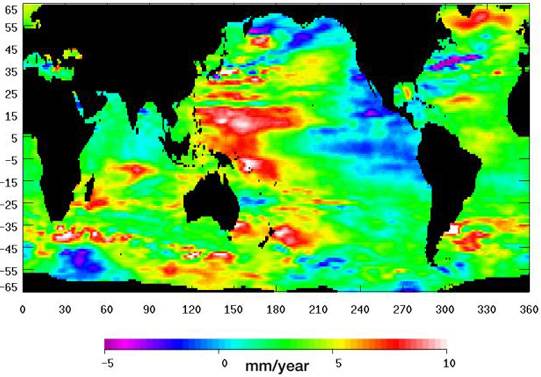
pretty pictures, even if the second one has a horrifying amount of red in it. what are they saying?
take a look for yourself. estimate the changes 20 years forward and 20 years in the past. does it make sense to you? will the SE Pacific continue to rise 10mm/yr while the NW Pacific drops?does that mean the SE Pac was lower before and the NW Pac higher? are the oceans sloshing around? is it some sort of standing wave? is it some sort of gravity effect from seismic activity? salinity difference? side effect of ocean temperature? what is it, how long will it last, what does it mean for predicting the future?
do you think that the GRACE data have any peculiarities that might suggest spurious trends that may not really be there? especially when many people are focussed on finding just those kinds of trend, spurious or not.
Old Rocks-
did you ever get around to answering my question about these trends in SeaLevelRise? does the water just keep piling up in one place, forever? doesnt that only happen in cartoons?
any other warmers can answer if they want to. so many things that the climate change consensus tells us to believe just dont make sense.
Well, as you say, we've been measure sealevel by satellite for about 20 years, if you go to the TOPEX and Jason systems. And yes, there are a lot sources of noise, from the bobbing of the continents to the tides of Sun and Moon, earthquakes storms and even a warming climate that is shifting weather bands and pumping more moisture into warmer air. Most of what we've seen (re: sealevel rise), so far, is due to the thermal expansion of the planet's oceans acting as a climate buffer by absorbing a portion of the energy our planet has retained over the last few centuries.
I don't know if I can adequately address all questions and issues you may have, but what I can't respond to, I'm more than willing to help you research and discover, if knowledge and understanding are your goals we're following similar paths.
Last edited:
I love satellite measurements. they have revolutionized many areas of study.
the difficulty with satellites is to get them properly calibrated and to figure out exactly what they are saying. temp readings have been around for 30 years and are probably pretty reliable. sea level readings have been around for 20 years and may be reliable but do we really know what they are telling us? GRACE gravity readings have been around for 10 years and are incredibly complex to analyze. calibrating GRACE involves making estimates and computer models and then seeing whether the data fit. I wouldnt bet my house on the accuracy of GRACE even if it gives precise results.
let's step back to the satellite altimetry from the last 20 years-
or this one which is more up-to-date
pretty pictures, even if the second one has a horrifying amount of red in it. what are they saying?
take a look for yourself. estimate the changes 20 years forward and 20 years in the past. does it make sense to you? will the SE Pacific continue to rise 10mm/yr while the NW Pacific drops?does that mean the SE Pac was lower before and the NW Pac higher? are the oceans sloshing around? is it some sort of standing wave? is it some sort of gravity effect from seismic activity? salinity difference? side effect of ocean temperature? what is it, how long will it last, what does it mean for predicting the future?
do you think that the GRACE data have any peculiarities that might suggest spurious trends that may not really be there? especially when many people are focussed on finding just those kinds of trend, spurious or not.
Old Rocks-
did you ever get around to answering my question about these trends in SeaLevelRise? does the water just keep piling up in one place, forever? doesnt that only happen in cartoons?
any other warmers can answer if they want to. so many things that the climate change consensus tells us to believe just dont make sense.
Well, as you say, we've been measure sealevel by satellite for about 20 years, if you go to the TOPEX and Jason systems. And yes, there are a lot sources of noise, from the bobbing of the continents to the tides of Sun and Moon, earthquakes storms and even a warming climate that is shifting weather bands and pumping more moisture into warmer air. Most of what we've seen (re: sealevel rise), so far, is due to the thermal expansion of the planet's oceans acting as a climate buffer by absorbing a portion of the energy our planet has retained over the last few centuries.
I don't know if I can adequately address all questions and issues you may have, but what I can't respond to, I'm more than willing to help you research and discover, if knowledge and understanding are your goals we're following similar paths.
thanks for not calling me a brainwashed cultist shill for the oil industry this time.
was your comment supposed to be an answer to my question? I asked if the trends on the maps of sealevelrise were sustainable. even for the twenty odd years of observations. how long can you keep adding close to a centimetre of water per year in one place before it decides to flow somewhere else? and what about the ad hoc 0.3mm/yr adjustment for rebound? does it make sense if you run it backwards in time?
I have lots more questions to ask after you get through with those. thanks in advance for responding. no, really! I would be happy to try and answer any questions you have as well.
bobgnote
Rookie
- Nov 24, 2008
- 1,258
- 38
- 0
- Banned
- #31
One problem is trade currents can fail, for any number of reasons, such as melting Arctic and Greenland ice puts too much fresh, cold water, into the North Atlantic.
This is causing a higher than normal rise, in sea level, between Cape Hatteras and Boston.
Then the jet stream will get out of the way, of African storms, and the East Coast will eat shit.
Then the local solar maximum will return, and temperatures will go way up. THEN we will see how much sea level will rise, in just a couple of years.
skookerasbil
Platinum Member
One problem is trade currents can fail, for any number of reasons, such as melting Arctic and Greenland ice puts too much fresh, cold water, into the North Atlantic.
This is causing a higher than normal rise, in sea level, between Cape Hatteras and Boston.
Then the jet stream will get out of the way, of African storms, and the East Coast will eat shit.
Then the local solar maximum will return, and temperatures will go way up. THEN we will see how much sea level will rise, in just a couple of years.
BUMMER......................

Last edited:
Trakar
VIP Member
- Feb 28, 2011
- 1,699
- 74
- 83
Well, as you say, we've been measure sealevel by satellite for about 20 years, if you go to the TOPEX and Jason systems. And yes, there are a lot sources of noise, from the bobbing of the continents to the tides of Sun and Moon, earthquakes storms and even a warming climate that is shifting weather bands and pumping more moisture into warmer air. Most of what we've seen (re: sealevel rise), so far, is due to the thermal expansion of the planet's oceans acting as a climate buffer by absorbing a portion of the energy our planet has retained over the last few centuries.
I don't know if I can adequately address all questions and issues you may have, but what I can't respond to, I'm more than willing to help you research and discover, if knowledge and understanding are your goals we're following similar paths.
thanks for not calling me a brainwashed cultist shill for the oil industry this time.
"this time"? I don't recall ever having done so, and that sounds completely inappropriate. Got link?
was your comment supposed to be an answer to my question? I asked if the trends on the maps of sealevelrise were sustainable. even for the twenty odd years of observations. how long can you keep adding close to a centimetre of water per year in one place before it decides to flow somewhere else? and what about the ad hoc 0.3mm/yr adjustment for rebound? does it make sense if you run it backwards in time?
I generally tend to look (first) at the Colorado University Sea Level Research Group for my information concerning such information. Which picture are you talking about the one from the bravenewclimate blog site or the one that isn't showing up from aviso.oceanobs?
I'd like to actually see what it is you are referencing, from a reliable source before I offer any comments.
I have lots more questions to ask after you get through with those. thanks in advance for responding. no, really! I would be happy to try and answer any questions you have as well.
Hey, I much prefer considered discussion with supporting cites and references, let's see if there is something here that needs a closer look.
Well, as you say, we've been measure sealevel by satellite for about 20 years, if you go to the TOPEX and Jason systems. And yes, there are a lot sources of noise, from the bobbing of the continents to the tides of Sun and Moon, earthquakes storms and even a warming climate that is shifting weather bands and pumping more moisture into warmer air. Most of what we've seen (re: sealevel rise), so far, is due to the thermal expansion of the planet's oceans acting as a climate buffer by absorbing a portion of the energy our planet has retained over the last few centuries.
I don't know if I can adequately address all questions and issues you may have, but what I can't respond to, I'm more than willing to help you research and discover, if knowledge and understanding are your goals we're following similar paths.
thanks for not calling me a brainwashed cultist shill for the oil industry this time.
"this time"? I don't recall ever having done so, and that sounds completely inappropriate. Got link?
.
please accept my apologies. I mistook you for a different poster.
was your comment supposed to be an answer to my question? I asked if the trends on the maps of sealevelrise were sustainable. even for the twenty odd years of observations. how long can you keep adding close to a centimetre of water per year in one place before it decides to flow somewhere else? and what about the ad hoc 0.3mm/yr adjustment for rebound? does it make sense if you run it backwards in time?
I generally tend to look (first) at the Colorado University Sea Level Research Group for my information concerning such information. Which picture are you talking about the one from the bravenewclimate blog site or the one that isn't showing up from aviso.oceanobs?
I'd like to actually see what it is you are referencing, from a reliable source before I offer any comments.
I have lots more questions to ask after you get through with those. thanks in advance for responding. no, really! I would be happy to try and answer any questions you have as well.
Hey, I much prefer considered discussion with supporting cites and references, let's see if there is something here that needs a closer look.
the university of Colorado graph is just fine. the bravenewclimate blog is irrelevent as the graph was found during a google image search.
satellite altimetry produces maps that show different sea level rise in different places. eg the south pacific seas show ~10mm/yr increase. the map states this is data for the last 20 years. are we to believe that the sea level is 200mm higher there and still rising? what is stopping the water from spreading out? I cant help but think that this is an artifact of volcanic and seismic activity that is distorting the gravity field.if that is the case then perhaps the altimetry results for the west peninsula of antarctica are similarly being affected by the volcanoes there. etc.
dont get me wrong, I think altimetry is great and opening up new possibilities in many places. I just think it is a new technology with a lot of bugs and corrections that havent been totally worked out yet. unfortunately any trend that seems to agree with CAGW is immediately released to the press, and any trend found which seems to disagree with CAGW leads to more adjustments to bring the results into better agreement with what was expected to be found.
Trakar
VIP Member
- Feb 28, 2011
- 1,699
- 74
- 83
thanks for not calling me a brainwashed cultist shill for the oil industry this time.
"this time"? I don't recall ever having done so, and that sounds completely inappropriate. Got link?
.
please accept my apologies. I mistook you for a different poster.
No problem, it happens. I'm not here that much and there are a lot of transient posters flowing through here.
Trakar
VIP Member
- Feb 28, 2011
- 1,699
- 74
- 83
was your comment supposed to be an answer to my question? I asked if the trends on the maps of sealevelrise were sustainable. even for the twenty odd years of observations. how long can you keep adding close to a centimetre of water per year in one place before it decides to flow somewhere else? and what about the ad hoc 0.3mm/yr adjustment for rebound? does it make sense if you run it backwards in time?
I generally tend to look (first) at the Colorado University Sea Level Research Group for my information concerning such information. Which picture are you talking about the one from the bravenewclimate blog site or the one that isn't showing up from aviso.oceanobs?
I'd like to actually see what it is you are referencing, from a reliable source before I offer any comments.
I have lots more questions to ask after you get through with those. thanks in advance for responding. no, really! I would be happy to try and answer any questions you have as well.
Hey, I much prefer considered discussion with supporting cites and references, let's see if there is something here that needs a closer look.
the university of Colorado graph is just fine. the bravenewclimate blog is irrelevent as the graph was found during a google image search.
Well that graph says University of Colorado, but it is from the BraveNewClimate blog site. I don't mean to doubt the blog's reliability, but I would really prefer to see a graph directly from and on a legitimate and authentic science site. I ran a cursory search at the Sea Level Research Group site (CU Sea Level Research Group | University of Colorado) and didn't see the graphic, but I haven't really spent any time in a more detailed search, I wanted to check and see if you had a better link first (sorry I wasn't more specific in what I was looking for last post).
satellite altimetry produces maps that show different sea level rise in different places. eg the south pacific seas show ~10mm/yr increase. the map states this is data for the last 20 years. are we to believe that the sea level is 200mm higher there and still rising? what is stopping the water from spreading out? I cant help but think that this is an artifact of volcanic and seismic activity that is distorting the gravity field.if that is the case then perhaps the altimetry results for the west peninsula of antarctica are similarly being affected by the volcanoes there. etc.
Until we can track down the actual graphic representation, and more importantly the data and methodologies from which the graphic is derived, it is difficult to do much beyond speculation. Remember, the crust, and the mantle it floats upon, are only semi-rigid in and of themselves. In most cases, it isn't the volcanoes which cause the mascon gravitational anomalies, it is the piling-up of crustal plates behind and ahead of a deep subduction area. This piling up causes a general geological uplift (think the early stages of a "buckling"). This gives us two mechanisms of local sea level rise beyond any that might be attributable to global average sea level rise (you see similar potentials in areas of negative sea level rise): 1) the local sea is actually being pushed up by a rising sea floor, 2) the mascon of the bulging crust is actually attracting sea water to pile up over top of the rising sea floor. The surface of the oceans subtly mirror the contours of the seafloor below them. The crucial point is whether or not this graphic, and more importantly, the data and the analysis understood and accounted for this variable. It is entirely possible that the satisfaction of our curiosity may lie in the paper and corresponding data from which this graphic was extracted.
((oh, and btw, pardon my ignorance but "CAGW"?))
I generally tend to look (first) at the Colorado University Sea Level Research Group for my information concerning such information. Which picture are you talking about the one from the bravenewclimate blog site or the one that isn't showing up from aviso.oceanobs?
I'd like to actually see what it is you are referencing, from a reliable source before I offer any comments.
Hey, I much prefer considered discussion with supporting cites and references, let's see if there is something here that needs a closer look.
the university of Colorado graph is just fine. the bravenewclimate blog is irrelevent as the graph was found during a google image search.
Well that graph says University of Colorado, but it is from the BraveNewClimate blog site. I don't mean to doubt the blog's reliability, but I would really prefer to see a graph directly from and on a legitimate and authentic science site. I ran a cursory search at the Sea Level Research Group site (CU Sea Level Research Group | University of Colorado) and didn't see the graphic, but I haven't really spent any time in a more detailed search, I wanted to check and see if you had a better link first (sorry I wasn't more specific in what I was looking for last post).
satellite altimetry produces maps that show different sea level rise in different places. eg the south pacific seas show ~10mm/yr increase. the map states this is data for the last 20 years. are we to believe that the sea level is 200mm higher there and still rising? what is stopping the water from spreading out? I cant help but think that this is an artifact of volcanic and seismic activity that is distorting the gravity field.if that is the case then perhaps the altimetry results for the west peninsula of antarctica are similarly being affected by the volcanoes there. etc.
Until we can track down the actual graphic representation, and more importantly the data and methodologies from which the graphic is derived, it is difficult to do much beyond speculation. Remember, the crust, and the mantle it floats upon, are only semi-rigid in and of themselves. In most cases, it isn't the volcanoes which cause the mascon gravitational anomalies, it is the piling-up of crustal plates behind and ahead of a deep subduction area. This piling up causes a general geological uplift (think the early stages of a "buckling"). This gives us two mechanisms of local sea level rise beyond any that might be attributable to global average sea level rise (you see similar potentials in areas of negative sea level rise): 1) the local sea is actually being pushed up by a rising sea floor, 2) the mascon of the bulging crust is actually attracting sea water to pile up over top of the rising sea floor. The surface of the oceans subtly mirror the contours of the seafloor below them. The crucial point is whether or not this graphic, and more importantly, the data and the analysis understood and accounted for this variable. It is entirely possible that the satisfaction of our curiosity may lie in the paper and corresponding data from which this graphic was extracted.
((oh, and btw, pardon my ignorance but "CAGW"?))
CAGW is catastrophic anthropogenic global warming.
Im not doing a scientific paper, or even a high school project. if I see the same type of map or graphic from different sources I assume that the overall basic idea is accepted in the scientific community. I dont go to the SIs of scientific papers and run R code to check their methodologies and illustrations. nor do 99.9% of the public. if blogs and such did not reprint graphics from universities and govt institutions then they would often simply disappear. eg. a link to a temp graph from GISS will typically break within a day or two, and GISS has made it impossible for information caching programs like 'the wayback machine' to capture past data sets.
gravity obviously is the concept behind the GRACE satellites, to the point where they have added much information about underwater mountain ranges and such. my problem with SeaLevelRise map is that they state the rise in mm/year and give the time frame for the map as eg.1992-2012. that leads to ridiculous results even in the time frame referenced let alone when you go backwards or forwards from the end points. staying with sealevelrise, the adjustment for GIA of 0.3mm/yr since satellite altimetry started in the 90's (deemed necessary when SLR dropped in the last 5 years) also leads to a mockery of measurements done by tidal gauges if you run it back in time.
Trakar
VIP Member
- Feb 28, 2011
- 1,699
- 74
- 83
NASA site.
this graphic seems to undercut the paper published this year that said parts of the US Atlantic Seaboard were rising at twice or three times the global average. Salinger2012 I think
Nasa newsite, which means that this graphic was connected to some study or paper discussed somewhere in a NASA website news story, but without knowing what study it comes from and the methodolgies that study applied as it performed its data analysis, all we can do is is speculate about what thinking might have went into its considerations.
Similar threads
- Replies
- 100
- Views
- 1K
- Replies
- 4
- Views
- 300
- Replies
- 315
- Views
- 3K
- Replies
- 131
- Views
- 2K
- Replies
- 169
- Views
- 1K
Latest Discussions
- Replies
- 11
- Views
- 48
Forum List
-
-
-
-
-
Political Satire 8870
-
-
-
-
-
-
-
-
-
-
-
-
-
-
-
-
-
-
-
ObamaCare 781
-
-
-
-
-
-
-
-
-
-
-
Member Usernotes 492
-
-
-
-
-
-
-
-
-
-