GOP Senator..."tough shit" for the unemployed

Status
Not open for further replies.
Oh, shut up!!! I have gone to a lot of trouble to do posts that are informative when one of you bagheads ask me a question, as you have just done. And then 2 things happen.

Either everybody disappears and nobody even comments. Or they SAY they read it, but you can tell by their response that they did not. So they tell me everything I have said is wrong and then I get called names. But either way I wasted my time even answering. I'm so done with that.

And I would like to point out that you NEVER respond when somebody asks you a question. So you know what you can do.

You weren't called any names. You were just asked 2 questions.

If you think you are wasting your time posting, then why post? No one is forcing you to enter into the debate.

I do have to question why you think we need to get away from the policies of the 1920s. It just doesn't make sense.

The Depression of 1920 was an incredibly short depression after the Government cut taxes by 66% and cut spending by %50. We had one of the greatest economic explosions in history.

The Depression of 1929 had the Progressive Republican Hoover, and FDR passing all kinds of government programs and lasted 12 years.

So why on earth are we following the progressive policies that prolonged the depression, rather than the tax/spending reduction policies that had us out of a deeper depression very quickly?
:clap2:

Bravo! Some still refuse to learn from history. (And more importantly? MOST in our society have been deprived of it and sadly, it rears it's ugly head). ;)
 
Oh, shut up!!! I have gone to a lot of trouble to do posts that are informative when one of you bagheads ask me a question, as you have just done. And then 2 things happen.

Either everybody disappears and nobody even comments. Or they SAY they read it, but you can tell by their response that they did not. So they tell me everything I have said is wrong and then I get called names. But either way I wasted my time even answering. I'm so done with that.

And I would like to point out that you NEVER respond when somebody asks you a question. So you know what you can do.

You weren't called any names. You were just asked 2 questions.

If you think you are wasting your time posting, then why post? No one is forcing you to enter into the debate.

I do have to question why you think we need to get away from the policies of the 1920s. It just doesn't make sense.

The Depression of 1920 was an incredibly short depression after the Government cut taxes by 66% and cut spending by %50. We had one of the greatest economic explosions in history.

The Depression of 1929 had the Progressive Republican Hoover, and FDR passing all kinds of government programs and lasted 12 years.

So why on earth are we following the progressive policies that prolonged the depression, rather than the tax/spending reduction policies that had us out of a deeper depression very quickly?

"You must spread some reputation around before giving it to Avatar4321 again..."
 
Look at the difference between how we backup our arguements.

I took the raw data from the Bureau of Labor Statistics regarding unemployment rates. I provided the link.

All I did was add the events of the power changes.

The liberals on the other side used a very underhanded and dishonest method.

They took some chart that said "road to recovery". It's not defined exactly what that means and what data is used.

They tag on "Bureau of Labor Statistics" in the chart, but in small letters on the bottom left it says "Speaker Of The House".

So Nancy Pelosi's office did this chart. They used whatever data they wanted, which is not defined in the chart, and they create a chart to show whatever they want to show .

Tsk tsk not very honest:eusa_liar:

LOL good point, Mike. They studied the AGW crowd very well, didn't they? ;)
 
Republican white house and congress

Bureau of Labor Statistics Data

Year Jan Feb Mar Apr May Jun Jul Aug Sep Oct Nov Dec Annual
2000 4.0 4.1 4.0 3.8 4.0 4.0 4.0 4.1 3.9 3.9 3.9 3.9
2001 4.2 4.2 4.3 4.4 4.3 4.5 4.6 4.9 5.0 5.3 5.5 5.7
2002 5.7 5.7 5.7 5.9 5.8 5.8 5.8 5.7 5.7 5.7 5.9 6.0
2003 5.8 5.9 5.9 6.0 6.1 6.3 6.2 6.1 6.1 6.0 5.8 5.7
2004 5.7 5.6 5.8 5.6 5.6 5.6 5.5 5.4 5.4 5.5 5.4 5.4
2005 5.3 5.4 5.2 5.2 5.1 5.0 5.0 4.9 5.0 5.0 5.0 4.9
2006 4.7 4.8 4.7 4.7 4.6 4.6 4.7 4.7 4.5 4.4 4.5 4.4

Democrats take over congress

2007 4.6 4.5 4.4 4.5 4.4 4.6 4.6 4.6 4.7 4.7 4.7 5.0
2008 5.0 4.8 5.1 5.0 5.4 5.5 5.8 6.1 6.2 6.6 6.9 7.4

Democrats have white house and congress

2009 7.7 8.2 8.6 8.9 9.4 9.5 9.4 9.7 9.8 10.1 10.0 10.0
2010 9.7


Any questions?

YouTube - '80s Anti-Drug Commercial - Your Brain On Drugs

Yeah, i've got a question...why haven't we seen this on the liberal media networks?

For the very same reason that brought Obama, The Democrats to power...

Two words, disingenuous manipulation.

Their agenda will never allow for the truth.
 
Well, good for Sen. Bunning making himself the poster boy for why the GOP shouldn't be given back the keys to the country. Gonna play really well this election season, eh?

so they have Bunning the other side has the skag Pelosi.....score R-1 D-1....who is going to be the tie breaker here....
 
Republican white house and congress

Bureau of Labor Statistics Data

Year Jan Feb Mar Apr May Jun Jul Aug Sep Oct Nov Dec Annual
2000 4.0 4.1 4.0 3.8 4.0 4.0 4.0 4.1 3.9 3.9 3.9 3.9
2001 4.2 4.2 4.3 4.4 4.3 4.5 4.6 4.9 5.0 5.3 5.5 5.7
2002 5.7 5.7 5.7 5.9 5.8 5.8 5.8 5.7 5.7 5.7 5.9 6.0
2003 5.8 5.9 5.9 6.0 6.1 6.3 6.2 6.1 6.1 6.0 5.8 5.7
2004 5.7 5.6 5.8 5.6 5.6 5.6 5.5 5.4 5.4 5.5 5.4 5.4
2005 5.3 5.4 5.2 5.2 5.1 5.0 5.0 4.9 5.0 5.0 5.0 4.9
2006 4.7 4.8 4.7 4.7 4.6 4.6 4.7 4.7 4.5 4.4 4.5 4.4

Democrats take over congress

2007 4.6 4.5 4.4 4.5 4.4 4.6 4.6 4.6 4.7 4.7 4.7 5.0
2008 5.0 4.8 5.1 5.0 5.4 5.5 5.8 6.1 6.2 6.6 6.9 7.4

Democrats have white house and congress

2009 7.7 8.2 8.6 8.9 9.4 9.5 9.4 9.7 9.8 10.1 10.0 10.0
2010 9.7


Any questions?

YouTube - '80s Anti-Drug Commercial - Your Brain On Drugs

Yeah, i've got a question...why haven't we seen this on the liberal media networks?


But, but, but....

Obama said unemployment wouldn't exceed 8%. WHAT HAPPENED???!!!???!!!!>????
 
Republican white house and congress

Bureau of Labor Statistics Data

Year Jan Feb Mar Apr May Jun Jul Aug Sep Oct Nov Dec Annual
2000 4.0 4.1 4.0 3.8 4.0 4.0 4.0 4.1 3.9 3.9 3.9 3.9
2001 4.2 4.2 4.3 4.4 4.3 4.5 4.6 4.9 5.0 5.3 5.5 5.7
2002 5.7 5.7 5.7 5.9 5.8 5.8 5.8 5.7 5.7 5.7 5.9 6.0
2003 5.8 5.9 5.9 6.0 6.1 6.3 6.2 6.1 6.1 6.0 5.8 5.7
2004 5.7 5.6 5.8 5.6 5.6 5.6 5.5 5.4 5.4 5.5 5.4 5.4
2005 5.3 5.4 5.2 5.2 5.1 5.0 5.0 4.9 5.0 5.0 5.0 4.9
2006 4.7 4.8 4.7 4.7 4.6 4.6 4.7 4.7 4.5 4.4 4.5 4.4

Democrats take over congress

2007 4.6 4.5 4.4 4.5 4.4 4.6 4.6 4.6 4.7 4.7 4.7 5.0
2008 5.0 4.8 5.1 5.0 5.4 5.5 5.8 6.1 6.2 6.6 6.9 7.4

Democrats have white house and congress

2009 7.7 8.2 8.6 8.9 9.4 9.5 9.4 9.7 9.8 10.1 10.0 10.0
2010 9.7


Any questions?

YouTube - '80s Anti-Drug Commercial - Your Brain On Drugs

Yeah, i've got a question...why haven't we seen this on the liberal media networks?

Dishonesty
 
obama-recovery-feb10b.jpg


hmmmmmm....

:lol: 
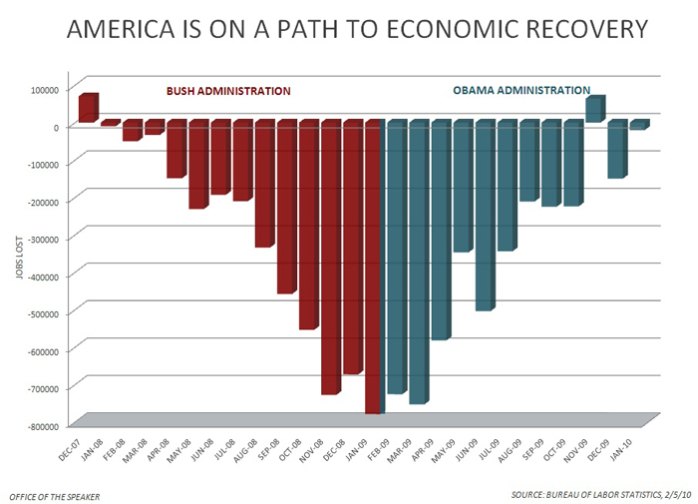
Office Of The Speaker indeed. Not surprising.

I notice it doesn't say based on what.

Source: Congressional Budget Office

bush_deficit_graphic.gif
 
Last edited by a moderator:
It'd be nice to see details on just the kind of people who would receive said "benefits." I've heard some pretty hilariously troubling horror stories about people on unemployment lately with my cousin being a recruiter.

It will be interesting if there is a republican in here who's unemployment check will just not be there next month. I wonder what he would say about the republicans.

Damn.
Who knows. All i know is that most conservatives tend to take care of themselves rather than looking for someone else to take care of them.

LOL. Do you realize how full of shit you truly are? For every dollar paid in, this is what these states recieve back. Two blue states, if you count DC as a state, and eight red states.


TaxProf Blog: Red States Feed at Federal Trough, Blue States Supply the Feed


1. D.C. ($6.17)
2. North Dakota ($2.03)
3. New Mexico ($1.89)
4. Mississippi ($1.84)
5. Alaska ($1.82)
6. West Virginia ($1.74)
7. Montana ($1.64)
8. Alabama ($1.61)
9. South Dakota ($1.59)
10. Arkansas ($1.53)

And these are the states that pay in the most;

1. New Jersey ($0.62)
2. Connecticut ($0.64)
3. New Hampshire ($0.68)
4. Nevada ($0.73)
5. Illinois ($0.77)
6. Minnesota ($0.77)
7. Colorado ($0.79)
8. Massachusetts ($0.79)
9. California ($0.81)
10. New York ($0.81)

Three red states, and seven blue states.

How come you damned Conservatives are so lazy?
 
LOL. Do you realize how full of shit you truly are? For every dollar paid in, this is what these states recieve back. Two blue states, if you count DC as a state, and eight red states.[/B]


TaxProf Blog: Red States Feed at Federal Trough, Blue States Supply the Feed


1. D.C. ($6.17)
2. North Dakota ($2.03)
3. New Mexico ($1.89)
4. Mississippi ($1.84)
5. Alaska ($1.82)
6. West Virginia ($1.74)
7. Montana ($1.64)
8. Alabama ($1.61)
9. South Dakota ($1.59)
10. Arkansas ($1.53)

And these are the states that pay in the most;

1. New Jersey ($0.62)
2. Connecticut ($0.64)
3. New Hampshire ($0.68)
4. Nevada ($0.73)
5. Illinois ($0.77)
6. Minnesota ($0.77)
7. Colorado ($0.79)
8. Massachusetts ($0.79)
9. California ($0.81)
10. New York ($0.81)

Three red states, and seven blue states.

How come you damned Conservatives are so lazy?

yea Wash DC....home of our lords and masters.....who sucks most of it in Rocks....
 
It will be interesting if there is a republican in here who's unemployment check will just not be there next month. I wonder what he would say about the republicans.

Damn.
Who knows. All i know is that most conservatives tend to take care of themselves rather than looking for someone else to take care of them.

LOL. Do you realize how full of shit you truly are? For every dollar paid in, this is what these states recieve back. Two blue states, if you count DC as a state, and eight red states.


TaxProf Blog: Red States Feed at Federal Trough, Blue States Supply the Feed


1. D.C. ($6.17)
2. North Dakota ($2.03)
3. New Mexico ($1.89)
4. Mississippi ($1.84)
5. Alaska ($1.82)
6. West Virginia ($1.74)
7. Montana ($1.64)
8. Alabama ($1.61)
9. South Dakota ($1.59)
10. Arkansas ($1.53)

And these are the states that pay in the most;

1. New Jersey ($0.62)
2. Connecticut ($0.64)
3. New Hampshire ($0.68)
4. Nevada ($0.73)
5. Illinois ($0.77)
6. Minnesota ($0.77)
7. Colorado ($0.79)
8. Massachusetts ($0.79)
9. California ($0.81)
10. New York ($0.81)

Three red states, and seven blue states.

How come you damned Conservatives are so lazy?

It's not lazy. It's lack of education.

I agree...you are quite the dumb ass.....tell us what the population is, the employment rate and the tax rate of the citizens in the States that pay in more than others.....then do the same for the States that receive more federal dollars.

The stats posted by oldshriveledbrain are horseshit DNC talking points.....like much of what you spew rdean.....
 
Status
Not open for further replies.

Forum List

Back
Top