GLOBAL WARMING? NASA says Antarctic has been COOLING for past

Status
Not open for further replies.
Yeah, and Antarctica is THE WHOLE WORLD, right?

dn17864-2_800.jpg

Besides, Antarctica has seen some of the lowest increases in temperatures over the last 125 years.


That must be the NOAA map.
You can tell by the lies....

If it doesn't agree with me, it's a lie.

Great debating skill that.

NOT!

Read the post 48.

I never was quite sure what the colorful map was suppose to show. Red is warmer? By how much warmer? Warmer for the last 5, 10, 15 or 1 year? At least if you go to the NOAA site you can do treads and baselines to your heart content. You will see that global temperature anomaly does in fact show and upward trend. The tread for the US, for at least the last 15 years, is down. I realize that the US is only 2 percent of the world's land mass. But I do believe smaller samples have been used to prove a theory. BTW the NOAA site gives average temperature for the US not anomaly which might be what your map shows.

Well, you know, if you actually LOOKED at the map, the scale is at the bottom.

Yeah, small samples have been used to "prove" lots of things, and mostly it's not worth listening to.

So, when someone from America tries to prove global cooling by showing that parts of America are cooling, you know what you've got.

Well I did look at the map and it does say from 1889, sorry I missed that.

What I guess I meant was what does this mean: Regional Temperature increase (degC) in a 4degC world, relative to 1890.

I took this from the NOAA site. Interesting that the chart you provided and the data NOAA provides does not go back to the same year.

Any way they are showing an about 1 degree F change for that time period, for the US. Which, as you know, is far less the 4 deg C. How does that jive with the chart you provided? Or are we mixing apples and oranges?

View attachment 55795

Now looking at global temperature anomaly we derive the following, which does show about a 2.1 deg F increase in those approximately 125 years, look at the data at the site below the chart:

View attachment 55796

I went and looked for the source of this picture. What it doesn't say on the map, is that this is what it may look like in 2055 assuming a 4 degree increase in temperatures.

No rainforest, no monsoon: get ready for a warmer world

So, yeah, the map I've shown isn't exactly what I thought it was. I was actually looking for one I had seen before, and this looked similar, but turns out it isn't that one.

Right now I can't look for what I want. The internet isn't playing ball, I can't get websites up with any speed at all, it might take an hour just to find what I want right now. I'll try and do it later.

Your link, I have heard it all before, many years ago. Those folks need to take some happy pills.
 
Yeah, and Antarctica is THE WHOLE WORLD, right?

dn17864-2_800.jpg

Besides, Antarctica has seen some of the lowest increases in temperatures over the last 125 years.

Looks like you need to send this map to NOAA.

From the above linked site:

View attachment 55727

Yeah, because my map shows 125 years, and your chart shows the last 15 years.

Did you never think that these might, just possibly, be different?
So who took the temperatures at the poles in 1890?

What a dumbass sheeple.

Yeah, because the ONLY way to find out temperatures is by actually reading them from a thermometer, right?
Do tell us how your experts obtained temperature readings of the poles in 1890.

You are just a gullable stooge.
 
Yeah, and Antarctica is THE WHOLE WORLD, right?

dn17864-2_800.jpg

Besides, Antarctica has seen some of the lowest increases in temperatures over the last 125 years.


That must be the NOAA map.
You can tell by the lies....

If it doesn't agree with me, it's a lie.

Great debating skill that.

NOT!

Read the post 48.

I never was quite sure what the colorful map was suppose to show. Red is warmer? By how much warmer? Warmer for the last 5, 10, 15 or 1 year? At least if you go to the NOAA site you can do treads and baselines to your heart content. You will see that global temperature anomaly does in fact show and upward trend. The tread for the US, for at least the last 15 years, is down. I realize that the US is only 2 percent of the world's land mass. But I do believe smaller samples have been used to prove a theory. BTW the NOAA site gives average temperature for the US not anomaly which might be what your map shows.

Well, you know, if you actually LOOKED at the map, the scale is at the bottom.

Yeah, small samples have been used to "prove" lots of things, and mostly it's not worth listening to.

So, when someone from America tries to prove global cooling by showing that parts of America are cooling, you know what you've got.

Well I did look at the map and it does say from 1889, sorry I missed that.

What I guess I meant was what does this mean: Regional Temperature increase (degC) in a 4degC world, relative to 1890.

I took this from the NOAA site. Interesting that the chart you provided and the data NOAA provides does not go back to the same year.

Any way they are showing an about 1 degree F change for that time period, for the US. Which, as you know, is far less the 4 deg C. How does that jive with the chart you provided? Or are we mixing apples and oranges?

View attachment 55795

Now looking at global temperature anomaly we derive the following, which does show about a 2.1 deg F increase in those approximately 125 years, look at the data at the site below the chart:

View attachment 55796

You must be careful when using NOAA data sets. The linked data set has been adjusted up 0.823 deg C since 1960 and before then lowered by -0.46 deg C ( a total change of about 1.3 deg C. Validity of the data is in question. Karl Et Al is garbage of the worst kind, fabrication and falsification.

ncdc20jan191520and20jan20001.gif


Source
 
Not only that it's besides the point.

If there is NATURAL cooling alongside MAN MADE warming, and temperatures are still going up, what does this suggest to you?

In the first place, manmade warming has not been proven...temperatures going up suggests that the earth is exiting an ice age and the long term trend will be up with occasional drops till the temperatures reach earth's normal temperature of about 22C...that is about 7 degrees warmer than the present. Earth history tells us that for most of history, it has been so warm that no ice at all existed at at least one pole and usually both.

Considering that the normal temperature is so warm that there is no ice at the poles, what does that suggest to you regarding man's ability to do anything whatsoever about warming?

Oh, and you know all this CO2 we're pumping into the air, do you know which place it has the biggest impact on?
It has no effect on the temperature anywhere. Are you aware that the ice age we are presently exiting began with CO2 levels higher than the present...and in fact ice ages have began with CO2 levels in excess of 1000, and even in excess of 4000ppm?

On the oceans, we're killing the oceans first. Great. So temperatures are neither here nor there, the oceans will be dead soon anyway.

Really? Are you aware that most of the life present in the oceans today evolved at a time when atmospheric CO2 levels were closer to 4000ppm. We are killing the oceans with pollution...not CO2. To bad we can't deal with real problems like pollution because the AGW hoax sucks all the air out of the room and all the treasure out of the coffers.
 
Yeah, and Antarctica is THE WHOLE WORLD, right?

dn17864-2_800.jpg

Besides, Antarctica has seen some of the lowest increases in temperatures over the last 125 years.

Looks like you need to send this map to NOAA.

From the above linked site:

View attachment 55727

Yeah, because my map shows 125 years, and your chart shows the last 15 years.

Did you never think that these might, just possibly, be different?
So who took the temperatures at the poles in 1890?

What a dumbass sheeple.

Yeah, because the ONLY way to find out temperatures is by actually reading them from a thermometer, right?
Do tell us how your experts obtained temperature readings of the poles in 1890.

You are just a gullable stooge.

Penguins, yes, penguins supplied them that is the answer.
 
Validity of the data is in question. Karl Et Al is garbage of the worst kind, fabrication and falsification.

Where is your evidence - or "proof" in your parlance - that Karl et al 2015 is "garbage of the worst kind, fabrication and falsification"?
 
Last edited:
Are you aware that the ice age we are presently exiting began with CO2 levels higher than the present...

Nobody should be aware of that, being it's nonsense. The Vostok ice core record shows CO2 levels never higher than 300 ppm for the past 400,000 years. The Dome-C ice core record shows CO2 levels never higher than 300 ppm for the past 800,000 years.

If you want to define the current ice age as starting with the Quaternary Glaciation 2.58 million years ago, it gets even worse for you, being that a big decrease in CO2 levels was what marked the onset of that ice age. That is, the ice age confirms global warming theory.

The Role of Carbon Dioxide During the Onset of Antarctic Glaciation

and in fact ice ages have began with CO2 levels in excess of 1000, and even in excess of 4000ppm

Not in the last 100 million years. If you go back further than that, the sun was significantly dimmer, so comparisons become apples and oranges.
 
[Do tell us how your experts obtained temperature readings of the poles in 1890

No problem. Anyone familiar with the basics knows about the various proxies.

Tree rings
Marine sediments
Glacial ice
Lake sediments
Historical
Speleothems (cave deposits)

An extended Arctic proxy temperature database for the past 2,000 years : Scientific Data

You are just a gullable stooge.

As that paper demonstrates, you, weatherman, are clearly the prime gullible stooge here. You were completely ignorant of all the actual science, because your masters trained you to be ignorant.

Now that you've been educated, you have a choice. You can take your masters to task and demand to know why they misinformed you so, leaving you twisting in the wind here. Or you can run back to them, drop to your knees and beg for more lies. We all know you'll choose the latter. Every cultist does.
 
Validity of the data is in question. Karl Et Al is garbage of the worst kind, fabrication and falsification.

Where is your evidence - or "proof" in your parlance - that Karl et al 2015 is "garbage of the worst kind, fabrication and falsification"?

Karl Et Al added temperature by infilling areas with "expected temps" then they used 2nd rate temps in ocean monitoring driving up ocean temps from the more accurate lower temps of much more reliable devices..

Take your dam blinders off.. Thomas's paper admits it and you refuse to see it.. The empirical evidence shows his adjustments were not only unwarranted but unjustified as well.

There are only two choices, you are willfully ignorant and you see it but refuse to admit it or you are stupid and dont see it becasue you do not use the scientific method correctly... So which is it?

( I even posted a graph showing what Thomas Karl did to recent temperatures and your lack of graph reading skills allowed it to go right over your dam head!)
 
In the first place, manmade warming has not been proven

Nothing in the natural sciences has ever been proven and you're a science moron to suggest such a thing. Overwhelming evidence, however, DOES indicate that human activity has been the primary cause of the warming experienced over the last 150 years. You're a science imbecile to reject it.

temperatures going up suggests that the earth is exiting an ice age

Temperatures going up suggest Atlas has built a fire under us. They suggest that the sun is about to go nova. They suggest a leakage of Harry Potter magic. They suggest that the air has become more transparent to the sun's radiation. They suggest that all the fires we've built and the fuel we've burned has simply warmed us all up. They suggest that one of our gods is real, is pissed and is going to slowly roast us to death.

You go on about good science and then tell us what the observations "suggest", without bothering to find one fucking drop of actual evidence to support your hypothesis over all the rest.

and the long term trend will be up with occasional drops till the temperatures reach earth's normal temperature of about 22C...that is about 7 degrees warmer than the present. Earth history tells us that for most of history, it has been so warm that no ice at all existed at at least one pole and usually both.

You keep piling on the stupid. For the entirety of human existence, both poles have had ice.

Considering that the normal temperature is so warm that there is no ice at the poles, what does that suggest to you regarding man's ability to do anything whatsoever about warming?

Considering that the poles have NEVER been ice free during human existence, what does that tell you about the wisdom of allowing it to happen in the geological wink of an eye because we're too stupid, too cowardly and too greedy to stop burning fossil fuels?

It has no effect on the temperature anywhere. Are you aware that the ice age we are presently exiting began with CO2 levels higher than the present...and in fact ice ages have began with CO2 levels in excess of 1000, and even in excess of 4000ppm?

Mamooth has already revealed your unending ignorance with regard to this comment.

On the oceans, we're killing the oceans first. Great. So temperatures are neither here nor there, the oceans will be dead soon anyway.

Really? Are you aware that most of the life present in the oceans today evolved at a time when atmospheric CO2 levels were closer to 4000ppm. We are killing the oceans with pollution...not CO2.

I know you've been told the following on multiple occasions but rejected it without comment as it conflicted with your climate fantasy: The CO2 levels in the ocean are increasing at a rate THOUSANDS of times faster than they have typically done throughout Earth's history. On past occasions when ocean pH changed as quickly as we are changing it (the PT boundary event), massive die-offs took place. CaCO3 erosion can't buffer the change as it normally would.

To bad we can't deal with real problems like pollution because the AGW hoax sucks all the air out of the room and all the treasure out of the coffers.

What pollution have we been unable to deal with from a lack of funds? Last time I checked, government generally deals with pollution by instituting new industrial and environmental regulations. Industry gets to pay the price, which they'll certainly pass to the consumer. But somewhere I missed where the state of the government's coffers has prevented the creation of new regulation.

"They suggest that the air has become more transparent to the sun's radiation." -- Crick

CO2 makes the atmosphere "more transparent to the sun's radiation."?

So Venus has a totally transparent atmosphere

Wow. The stuff you learn from the AGWCult
 
[Do tell us how your experts obtained temperature readings of the poles in 1890

No problem. Anyone familiar with the basics knows about the various proxies.

Tree rings
Marine sediments
Glacial ice
Lake sediments
Historical
Speleothems (cave deposits)

An extended Arctic proxy temperature database for the past 2,000 years : Scientific Data

You are just a gullable stooge.

As that paper demonstrates, you, weatherman, are clearly the prime gullible stooge here. You were completely ignorant of all the actual science, because your masters trained you to be ignorant.

Now that you've been educated, you have a choice. You can take your masters to task and demand to know why they misinformed you so, leaving you twisting in the wind here. Or you can run back to them, drop to your knees and beg for more lies. We all know you'll choose the latter. Every cultist does.

As usual Mantooth shows its ignorance and misconstrues what the paper indicates. Proxies are at a minimum 5-10 years near surface and as wide as 500 years at more compressed stages. You failed to read what it is your posting about. "robust" for these people is any proxy which is shorter than 150 years per data point.
 
Are you aware that the ice age we are presently exiting began with CO2 levels higher than the present...

Nobody should be aware of that, being it's nonsense. The Vostok ice core record shows CO2 levels never higher than 300 ppm for the past 400,000 years. The Dome-C ice core record shows CO2 levels never higher than 300 ppm for the past 800,000 years.

The vostok ice cores only show CO2 levels during an ice age you crazy old woman...you are aware...never mind, I'm sure you aren't aware that cold oceans hold far more CO2 than warm oceans do.

If you want to define the current ice age as starting with the Quaternary Glaciation 2.58 million years ago, it gets even worse for you, being that a big decrease in CO2 levels was what marked the onset of that ice age. That is, the ice age confirms global warming theory.

Sorry hairball...when the slide into the ice age began, CO2 levels were greater than they are at present...wouldn't expect you to know that either...don't really expect you to know anything.


Not in the last 100 million years. If you go back further than that, the sun was significantly dimmer, so comparisons become apples and oranges.

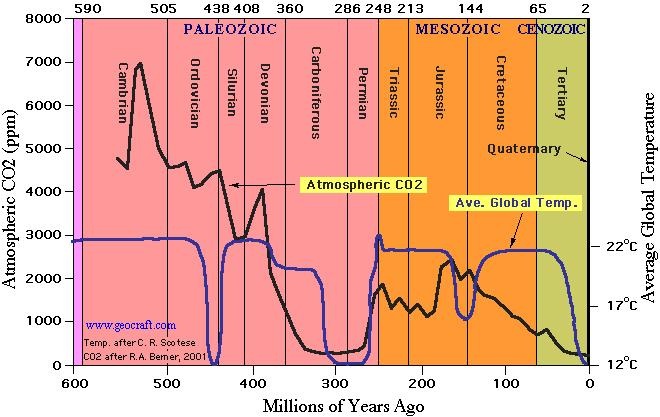
Sorry hairball...you lose again...I don't expect for you to be able to read this graph...and suggest that you don't ask crick because he certainly can't read a graph...As you can' see, when the slide into the present ice age began, CO2 levels were just about 1000ppm...and till such time as it's warm enough to melt the ice at both poles, we will remain in an ice age.... Try googling "the present ice age" and see all the scholarly hits.

1CO2EarthHistory_zps8b3938eb.gif
 
Karl Et Al added temperature by infilling areas with "expected temps" then they used 2nd rate temps in ocean monitoring driving up ocean temps from the more accurate lower temps of much more reliable devices.

Take your dam blinders off.. Thomas's paper admits it and you refuse to see it.. The empirical evidence shows his adjustments were not only unwarranted but unjustified as well.

There are only two choices, you are willfully ignorant and you see it but refuse to admit it or you are stupid and dont see it becasue you do not use the scientific method correctly... So which is it?

( I even posted a graph showing what Thomas Karl did to recent temperatures and your lack of graph reading skills allowed it to go right over your dam head!)

From Karl et al 2015

The data used in our long-term global temperature analysis primarily involve surface air temperature observations taken at thousands of weather-observing stations over land, and for coverage across oceans, the data are sea surface temperature (SST) observations taken primarily by thousands of commercial ships and drifting surface buoys. These networks of observations are always undergoing change. Changes of particular importance include (i) an increasing amount of ocean data from buoys, which are slightly different than data from ships; (ii) an increasing amount of ship data from engine intake thermometers, which are slightly different than data from bucket seawater temperatures; and (iii) a large increase in land-station data, which enables better analysis of key regions that may be warming faster or slower than the global average. We address all three of these, none of which were included in our previous analysis used in the IPCC report (1).

From Karl et al 2015, Supplementary Material, Data and Methods

Data and Analysis Method: 13 The new analyses presented here are based on foundational datasets and processing 14 procedures for land surface air temperature and sea surface temperature. The data sets are the 15 publically available ERSST v4 data set of sea surface temperature anomalies (13) 16 (ftp://ftp.ncdc.noaa.gov/pub/data/cmb/ersst/v4), and the ISTI Databank v1.0.0 of land surface air 17 temperature (14) (Databank - International Surface Temperature Initiative). A global grid of land and 18 ocean anomalies are produced from the two independent data sets using the procedures described 19 below. 20 Land Surface Air Temperature: Bias corrections are applied to stations in the ISTI v1.0.0 21 databank as described by Menne and Williams (21). This is followed by computation of 22 temperature anomalies for the stations in the databank. The anomalies are then averaged within 23 5ºx5º boxes. From the gridded anomalies a global analysis is performed for each year-month 24 using Empirical Orthogonal Teleconnections as described by Smith et al. (28). The resulting in- 25 filled 5ºx5º grid of monthly anomalies is then area-averaged using cosine weighting to produce 26 globally averaged land surface air temperature anomalies for each month from 1880 to present. 27 28 Sea Surface Temperature: ERSST v4 provides monthly sea surface temperature 29 anomalies with respect to the 1971-2000 base period for a global 2ºx2º grid. The gridded field is 30 produced from ship and buoy sea surface temperatures in the ICOADS release 2.5 data set (29) 31 using bias correction and Empirical Orthogonal Teleconnection methodologies as described in 32 (13). The addition of buoy data in recent decades has been particularly important as the spatial 33 coverage from ship observations has decreased since the 1990’s (cf. Fig. 1(a) in (13)). As stated 34 in this article, three of the 11 major improvements incorporated into ERSST version 4 had by far 35 the largest impact on the trend during the recent “hiatus” period (2000-2014). To make the buoy 36 data equivalent to ship data on average requires a straightforward addition of 0.12°C to each 37 buoy observation. This impacts the trend only because the number of buoys and percentage of 38 coverage by buoys has increased over this period. 39 40 In addition, because buoy data were determined to have less noise than ship data (greater 41 precision), another improvement was to give buoy data more weight when using Empirical 42 Orthogonal Teleconnections to reconstruct SST (see equation 3 in (13)). With this correction, 43 the buoy data have now been homogeneously integrated with the ship data. This resulted in 44 additional warming. 45 46 The factor that contributed the largest change in SST trends over this period was 47 continuing to make corrections to ship data after 1941. These corrections are based on 48 information derived from night marine air temperature. This correction cools the ship data a bit 49 more in 1998-2000 than it does in the later years, which thereby adds to the warming trend. To 50 evaluate the robustness of this correction, trends of the corrected and uncorrected ship data were 51 compared to co-located buoy data without the offset added. As the buoy data did not include the 52 offset the buoy data are independent of the ship data. The trend of uncorrected ship minus buoy data was -0.066°C dec-1 53 over the period 2000-2014, while the trend in corrected ship minus buoy Page 3 of 6 data was -0.002°C dec-1 54 . This close agreement in the trend of the corrected ship data indicates 55 that these time dependent ship adjustments did indeed correct an artifact in ship data impacting 56 the trend over this hiatus period.

In filling with "expected temperatures" is not the boogey man you seem to think it is. They are not padding their data with numbers intended to warm the results. It is very intelligently done interpolation and, as their numbers show, quite statistically sound - more sound than the hiatus-accepting results the IPCC published in AR5.

I do not know what you mean by "2nd rate temps" in determining SST numbers. They gave weight to the more accurate buoy data and a comparison of the trends of corrected and uncorrected SST data indicate that they did successfully correct an existing bias.

Who is "Thomas", in "Thomas' paper"? And what empirical evidence do you believe shows Karl adjustments to be unwarranted and unjustified?
 
Are you aware that the ice age we are presently exiting began with CO2 levels higher than the present...

Nobody should be aware of that, being it's nonsense. The Vostok ice core record shows CO2 levels never higher than 300 ppm for the past 400,000 years. The Dome-C ice core record shows CO2 levels never higher than 300 ppm for the past 800,000 years.

The vostok ice cores only show CO2 levels during an ice age you crazy old woman...you are aware...never mind, I'm sure you aren't aware that cold oceans hold far more CO2 than warm oceans do.

If you want to define the current ice age as starting with the Quaternary Glaciation 2.58 million years ago, it gets even worse for you, being that a big decrease in CO2 levels was what marked the onset of that ice age. That is, the ice age confirms global warming theory.

Sorry hairball...when the slide into the ice age began, CO2 levels were greater than they are at present...wouldn't expect you to know that either...don't really expect you to know anything.


Not in the last 100 million years. If you go back further than that, the sun was significantly dimmer, so comparisons become apples and oranges.

Sorry hairball...you lose again...I don't expect for you to be able to read this graph...and suggest that you don't ask crick because he certainly can't read a graph...As you can' see, when the slide into the present ice age began, CO2 levels were just about 1000ppm...and till such time as it's warm enough to melt the ice at both poles, we will remain in an ice age.... Try googling "the present ice age" and see all the scholarly hits.

1CO2EarthHistory_zps8b3938eb.gif
Better get your quotes straight. Those are not my words.
 
In the first place, manmade warming has not been proven

Nothing in the natural sciences has ever been proven and you're a science moron to suggest such a thing. Overwhelming evidence, however, DOES indicate that human activity has been the primary cause of the warming experienced over the last 150 years. You're a science imbecile to reject it.

temperatures going up suggests that the earth is exiting an ice age

Temperatures going up suggest Atlas has built a fire under us. They suggest that the sun is about to go nova. They suggest a leakage of Harry Potter magic. They suggest that the air has become more transparent to the sun's radiation. They suggest that all the fires we've built and the fuel we've burned has simply warmed us all up. They suggest that one of our gods is real, is pissed and is going to slowly roast us to death.

You go on about good science and then tell us what the observations "suggest", without bothering to find one fucking drop of actual evidence to support your hypothesis over all the rest.

and the long term trend will be up with occasional drops till the temperatures reach earth's normal temperature of about 22C...that is about 7 degrees warmer than the present. Earth history tells us that for most of history, it has been so warm that no ice at all existed at at least one pole and usually both.

You keep piling on the stupid. For the entirety of human existence, both poles have had ice.

Considering that the normal temperature is so warm that there is no ice at the poles, what does that suggest to you regarding man's ability to do anything whatsoever about warming?

Considering that the poles have NEVER been ice free during human existence, what does that tell you about the wisdom of allowing it to happen in the geological wink of an eye because we're too stupid, too cowardly and too greedy to stop burning fossil fuels?

It has no effect on the temperature anywhere. Are you aware that the ice age we are presently exiting began with CO2 levels higher than the present...and in fact ice ages have began with CO2 levels in excess of 1000, and even in excess of 4000ppm?

Mamooth has already revealed your unending ignorance with regard to this comment.

On the oceans, we're killing the oceans first. Great. So temperatures are neither here nor there, the oceans will be dead soon anyway.

Really? Are you aware that most of the life present in the oceans today evolved at a time when atmospheric CO2 levels were closer to 4000ppm. We are killing the oceans with pollution...not CO2.

I know you've been told the following on multiple occasions but rejected it without comment as it conflicted with your climate fantasy: The CO2 levels in the ocean are increasing at a rate THOUSANDS of times faster than they have typically done throughout Earth's history. On past occasions when ocean pH changed as quickly as we are changing it (the PT boundary event), massive die-offs took place. CaCO3 erosion can't buffer the change as it normally would.

To bad we can't deal with real problems like pollution because the AGW hoax sucks all the air out of the room and all the treasure out of the coffers.

What pollution have we been unable to deal with from a lack of funds? Last time I checked, government generally deals with pollution by instituting new industrial and environmental regulations. Industry gets to pay the price, which they'll certainly pass to the consumer. But somewhere I missed where the state of the government's coffers has prevented the creation of new regulation.

"They suggest that the air has become more transparent to the sun's radiation." -- Crick

CO2 makes the atmosphere "more transparent to the sun's radiation."?

So Venus has a totally transparent atmosphere

Wow. The stuff you learn from the AGWCult


Jesus, Frank, your stupid knows no bound.
 
Status
Not open for further replies.

Forum List

Back
Top