- Mar 3, 2006
- 7,216
- 2,564
- 315
Move around the world. The cooling you're experiencing is just one lobe of the Rossby waves in the jet stream. .....
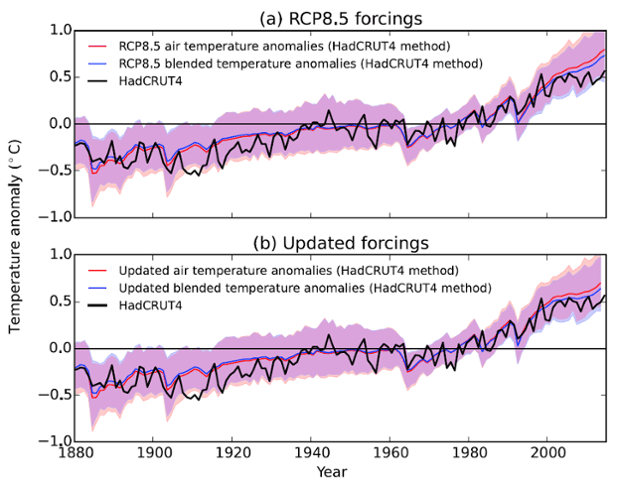
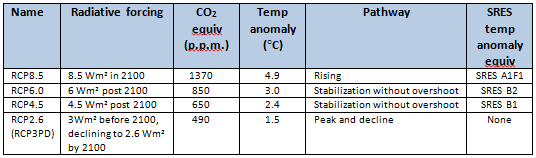
Instrumental temperature record - Wikipedia
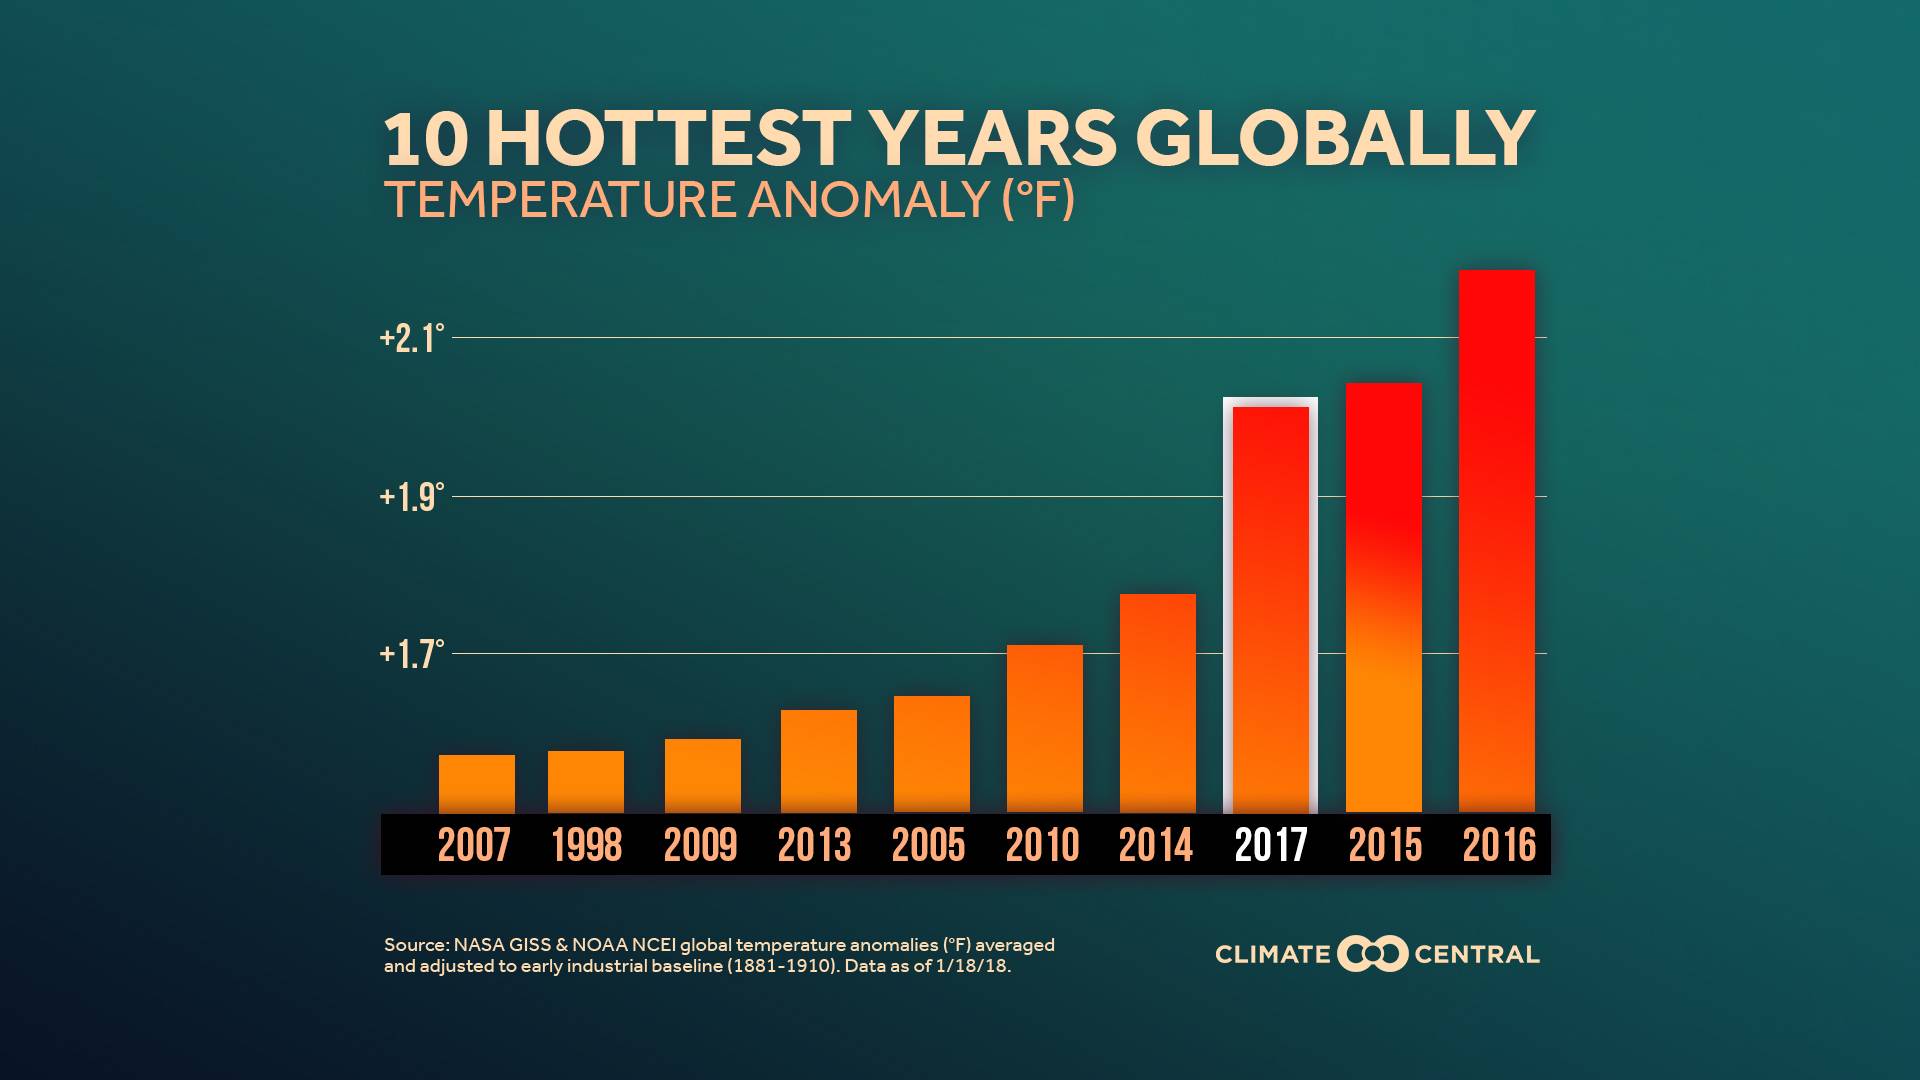
Top 10 warmest years (NOAA)(1880–2017)
Rank -Year - Anomaly °C - Anomaly °F
1. 2016 - 0.94 1.69
2. 2015 - 0.90 1.62
3. 2017 - 0.84 1.51
4. 2014 - 0.74 1.33
5. 2010 - 0.70 1.26
6. 2013 - 0.66 1.19
7. 2005 - 0.65 1.17
8. 2009 - 0.64 1.15
9. 1998 - 0.63 1.13
10. 2012 - 0.62 1.12
`
2. 2015 - 0.90 1.62
3. 2017 - 0.84 1.51
4. 2014 - 0.74 1.33
5. 2010 - 0.70 1.26
6. 2013 - 0.66 1.19
7. 2005 - 0.65 1.17
8. 2009 - 0.64 1.15
9. 1998 - 0.63 1.13
10. 2012 - 0.62 1.12
`
Last edited: