Global Warmers Stopped by Arctic Ice

Status
Not open for further replies.
Arctic ice is disappearing. The trends over the last 35 years indicate that we are very likely to have our first ice-free summer in less than a decade - likely less than 5 years.


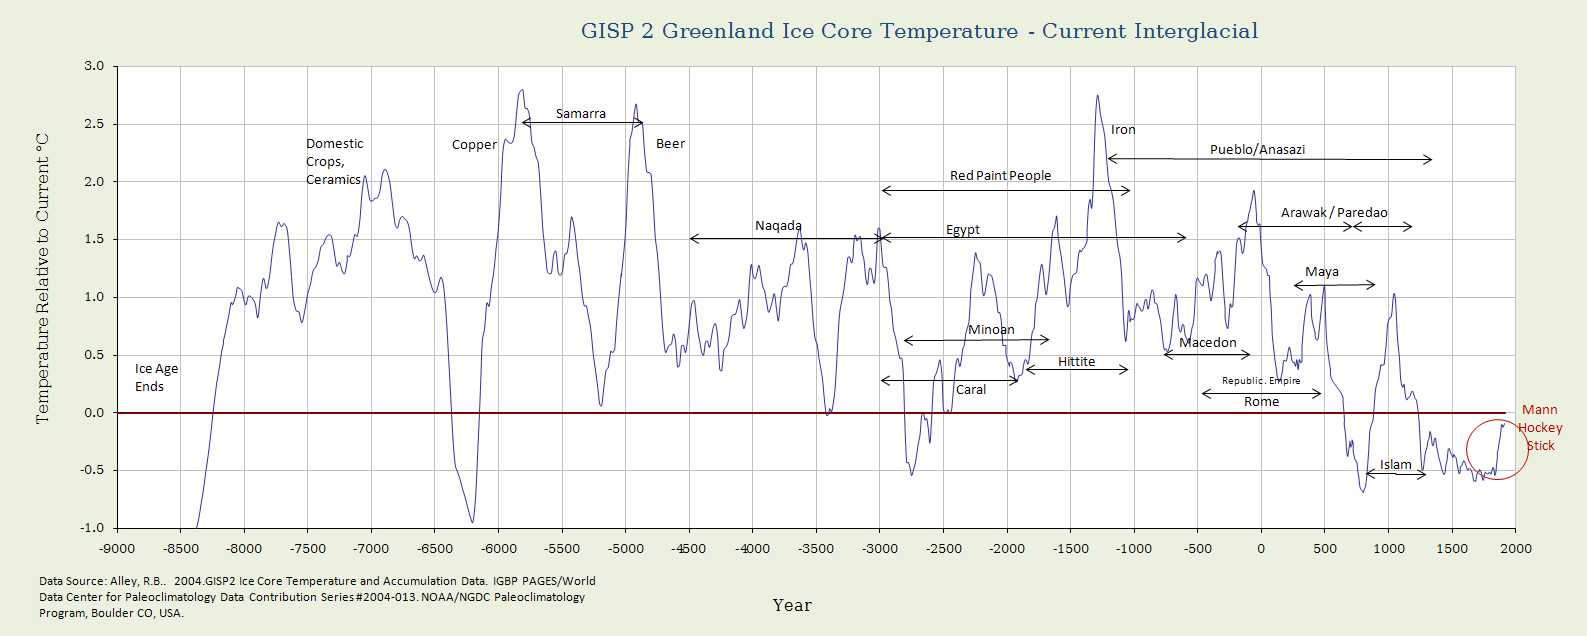
The same claim was made in 2007, 2008, and 2009...and what does the term "our" first ice free summer mean? Certainly not the first summer that humanity has spent when there was no ice in the arctic even though they were taken within the arctic circle...again...refer to the graph of the ice cores from greenland... if you fear an ice free arctic at the present temperatures....how much ice do you think was there 1000 years ago?....1500 years ago?....3300 years ago to 1000 years ago with the exception of the two short cool periods?

Or are you just in a dither because it is the first time modern man might experience what seems to have been the norm fro 10000 years ago till about 1300 years ago? Ice at the north pole is the anomaly on planet earth...not the norm...so again, why are you waving your hands hysterically over the planet doing what the planet normally does?

BztF1.jpg
 
Does anyone out there have Arctic ice mass data that refutes PIOMAS? Extents data that refutes NSIDC?
 
How were temperature accurate to a tenth of a degree back in 1880?
 
Last edited:
You must think the Stone Age ended with the invention of color TV.

Besides which, you're in the wrong thread. This one concerns ice in the Arctic.
 
You must think the Stone Age ended with the invention of color TV.

Besides which, you're in the wrong thread. This one concerns ice in the Arctic.
what do you supposed is melting the sea ice? Do you even know?
 
Besides which, you're in the wrong thread. This one concerns ice in the Arctic.


which reminds us that the FRAUD uses CHERRY PICKING, because Antarctic ice and sea ice are both GROWING....

which leads to the following question...

If Co2 is melting Arctic sea ice, why is Antarctic sea ice growing???

LMFAO!!
 
You must think the Stone Age ended with the invention of color TV.

Besides which, you're in the wrong thread. This one concerns ice in the Arctic.
what do you supposed is melting the sea ice? Do you even know?


Obviously warm ocean currents that move heat from the tropics to the poles, with an assist from wind currents that blow ice out of the Arctic.
 
Besides which, you're in the wrong thread. This one concerns ice in the Arctic.


which reminds us that the FRAUD uses CHERRY PICKING, because Antarctic ice and sea ice are both GROWING....
which leads to the following question...
If Co2 is melting Arctic sea ice, why is Antarctic sea ice growing???

The classic explanation, given by Hansen back in 1980, was that increased global temperatures would increase global humidity and thus precipitation. Antartica, still a great long ways from melting in its interior, would collect that precipitation as snow. That increases the drive pushing glaciers off the coast. The simultaneous breakup of major ice sheets (Pine Island, Thwaites, Larson A and B, etc) thinned by upwelling warm water uncorked several massive glaciers whose flow rate increased roughly five-fold. That increased the supply of ice to the sheets and they expanded.

Now, THIS thread concerns ice in the Arctic, as I think I already told you. If you have some comment about THAT ice, do carry on.


This was yesterday. Looks like it's just a little bit below the 20 year average. Huh. It was supposed to be long gone by now....

arctic.seaice.color.000.png
 
The estimates I originally heard were 2080 to 2100. As more time's gone by, more satellite data's been collected, the curve better and better defined and we simply get closer and closer to zero, the index point where it finally crosses the axis becomes more and more well defined. Your photograph does absolutely nothing to refute PIOMAS or NSIDC, does it.
 
Here's one a little easier to make out. Yesterday's from NSIDC

upload_2016-8-23_19-1-59.png


the orange line is the median area for this date between 1981 and 2010. This, of course, only shows extents. A mass comparison is considerably more dramatic.
 
The estimates I originally heard were 2080 to 2100. As more time's gone by, more satellite data's been collected, the curve better and better defined and we simply get closer and closer to zero, the index point where it finally crosses the axis becomes more and more well defined. Your photograph does absolutely nothing to refute PIOMAS or NSIDC, does it.


There was less Arctic ice in the 1950's. How come you don't mention that?
 
Here's one a little easier to make out. Yesterday's from NSIDC

View attachment 86671

the orange line is the median area for this date between 1981 and 2010. This, of course, only shows extents. A mass comparison is considerably more dramatic.


Sure doesn't look like the Satellite image I posted up. They do some of their "magic" to reduce it that much?
 
Here's one a little easier to make out. Yesterday's from NSIDC

View attachment 86671

the orange line is the median area for this date between 1981 and 2010. This, of course, only shows extents. A mass comparison is considerably more dramatic.

Sure doesn't look like the Satellite image I posted up. They do some of their "magic" to reduce it that much?


At least it's legible. Your image, not so much.
 
Here's some interesting discussion from Judith Curry. Historic Variations in Arctic sea ice. Part II: 1920-1950 Among a number of other things, it basically states that the ice extents data prior to the satellite record is shite.

Actually that's not what they say at all. Color me unsurprised that you lie about it.

Liar

Historic Variations in Arctic sea ice. Part II: 1920-1950
How reliable are the sea ice observations during the first half of the 20th century?

During the period 1920-1940, the Arctic Ocean was regarded as relatively unexplored territory. A 1934 National Geographic article discusses the Lindbergh’s flights over the Arctic:

“National Geographic, Sept. 1934, pp. 261-304, “Flying Around the North Atlantic” by Anne Morrow Lindbergh. She and her husband crossed the icecap twice, followed the coastline, from Disko Bay area to Clavering Island, visited Dr.Lauge Koch’s research area, and literally ”redrew” the map of some areas of Greenland.”

The lack of data from Russia and other areas because its sheer remoteness made accurate data gathering problematic, large gaps in knowledge due to WW2 i.e no DMI maps (Danish Meteorological Institute) during this period, a hiatus in cooperation during the Cold war, uncertainty over final summer amounts as DMI did not usually record data after August, and estimates by climatological methods means historic sea ice data is fragmented and incomplete. This is not helped by the different sea ice data bases often being at considerable variance with each other and changes in the way in which ice concentrations were calculated as described below:

“In 1968, The United States began reporting ice concentration in eights rather than tenths, then returned to tenths reporting in 1980. Canada retained the tenths format throughout the period. […….] SIC summary analyses in eights frequently overlay reconnaissance data which is plotted in tenths. Since SIC produced these charts for in-house, not public use, which of these formats is used is seldom noted on the charts….There is also a period when U.S. recon data receives a slightly different treatment from chart to chart…… With a good knowledge of codes and the history of code changes and a dash of intuition and care, it is possible to roam the data set without great fear of misinterpretation. Others entering without some preparation may find it hazardous.” [link]

Of course, professional arctic sea ice researchers are aware of these factors and adjust data accordingly but the preceding does raise the question as to whether X amount of ice in the satellite era (1979 onwards) is really the same as X amount in the period prior to that, derived through climatological or physical observations in often difficult conditions by such as whalers, which brings us to the thorny question of what the definition of ice extent actually is.

This concern led me to ask the following question of NSIDC:

“ …..how did pre satellite researchers estimating sea ice extent tell the difference between water, water floating on ice, and solid ice, and how can satellites differentiate between the three states? I was struck by Russian reports from the 1950’s at The Scott Polar institute in Cambridge when staff at the floating research stations commented about using Wellington boots in order to walk around the station, and how little dry ice islands eventually formed by the end of the summer surrounded by water on top of ice.”

I received the following reply from Julienne Stroeve (reproduced with permission):

“ … using passive microwave data it is very easy to tell the difference between ice and water as the dielectric constant differs quite a bit and this is reflected in large differences in the microwave emission. The main advantage of using passive microwave is that it can see the ice even if it’s cloudy or dark. There is a problem however in summer when melt ponds form on the ice since the sea ice algorithms then underestimate how much ice there really is (they think it’s open water). That’s one reason why we focus on extent rather than true ice area for the NSIDC sea ice news and analysis web site.

Visible and thermal imagery provides higher spatial resolution but is often hampered by clouds. Trying to do this work using earlier visible and thermal imagery requires the scientists to go through each image and manually filter out the clouds and determine where the ice is.

The Arctic in those pre satellite days was simply too large to be effectively and continually monitored. Observers getting close enough to the ice edge to make physical observations might be deterred from proceeding further by apparently impenetrable ice although better, more open conditions, might lie beyond. Data from such as the Russian sector – where much warming occurred, was not always taken into account. (However, the reader should be aware that, as Larsen noted, ice did sporadically return whilst reports from 1939-45 are sparse for obvious reasons.)

In trying to determine the true extent of sea ice during the period we run the risk of comparing apples-physical observations, and oranges- satellite altimetry, and the different methods employed over the years creates uncertainties over whether each accurately picked up what is ice, what is water covered ice and what is open water. This makes it difficult to determine how modern ice extent compares to the past with any certainty.
 
Here's one a little easier to make out. Yesterday's from NSIDC

View attachment 86671

the orange line is the median area for this date between 1981 and 2010. This, of course, only shows extents. A mass comparison is considerably more dramatic.


Sure doesn't look like the Satellite image I posted up. They do some of their "magic" to reduce it that much?
http://arctic.atmos.uiuc.edu/cryosphere/NEWIMAGES/arctic.seaice.color.000.png

Mr. Westwall, you are an idiot. Above is the image you posted. It is from April. Here you can see the instrument that normally makes the measurement go offline;

Northern Hemisphere Sea Ice Area

That Mr. Westwall does not recognize this is either demonstrating his senility, or his continual lies.
 
Status
Not open for further replies.

Forum List

Back
Top