Remarkable article from the Watts site. Here are some excerpts but I strongly encourage you all to read the entire article. The disparity between truth and manipulated intent is revealed for all who take the time to see...
___
There are three main global temperature datasets. One is at the CRU, Climate Research Unit of the University of East Anglia, where we’ve been trying to get access to the raw numbers. One is at NOAA/GHCN, the Global Historical Climate Network. The final one is at NASA/GISS, the Goddard Institute for Space Studies. The three groups take raw data, and they “homogenize” it to remove things like when a station was moved to a warmer location and there’s a 2C jump in the temperature. The three global temperature records are usually called CRU, GISS, and GHCN. Both GISS and CRU, however, get almost all of their raw data from GHCN. All three produce very similar global historical temperature records from the raw data.
So I’m still on my multi-year quest to understand the climate data. You never know where this data chase will lead. This time, it has ended me up in Australia. I got to thinking about Professor Wibjorn Karlen’s statement about Australia that I quoted here:
Another example is Australia. NASA [GHCN] only presents 3 stations covering the period 1897-1992. What kind of data is the IPCC Australia diagram based on?
If any trend it is a slight cooling. However, if a shorter period (1949-2005) is used, the temperature has increased substantially. The Australians have many stations and have published more detailed maps of changes and trends.
The folks at CRU told Wibjorn that he was just plain wrong. Here’s what they said is right, the record that Wibjorn was talking about, Fig. 9.12 in the UN IPCC Fourth Assessment Report, showing Northern Australia:
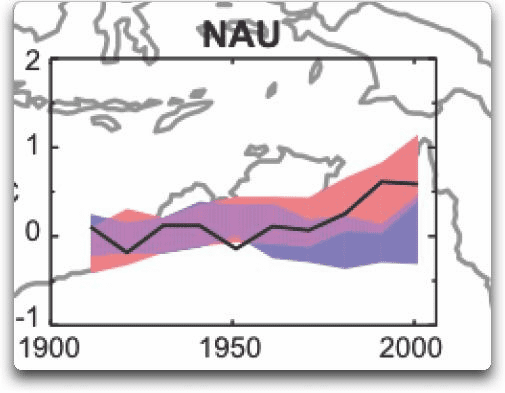
Figure 1. Temperature trends and model results in Northern Australia. Black line is observations (From Fig. 9.12 from the UN IPCC Fourth Annual Report). Covers the area from 110E to 155E, and from 30S to 11S. Based on the CRU land temperature.) Data from the CRU.
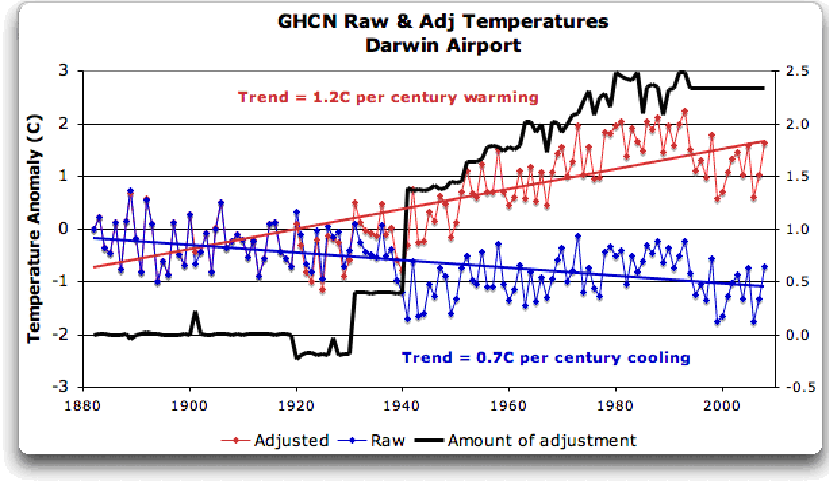
...Then I went to look at what happens when the GHCN removes the “in-homogeneities” to “adjust” the data. Of the five raw datasets, the GHCN discards two, likely because they are short and duplicate existing longer records. The three remaining records are first “homogenized” and then averaged to give the “GHCN Adjusted” temperature record for Darwin.
To my great surprise, here’s what I found. To explain the full effect, I am showing this with both datasets starting at the same point (rather than ending at the same point as they are often shown).
...Intrigued by the curious shape of the average of the homogenized Darwin records, I then went to see how they had homogenized each of the individual station records. What made up that strange average shown in Fig. 7? I started at zero with the earliest record. Here is Station Zero at Darwin, showing the raw and the homogenized versions.
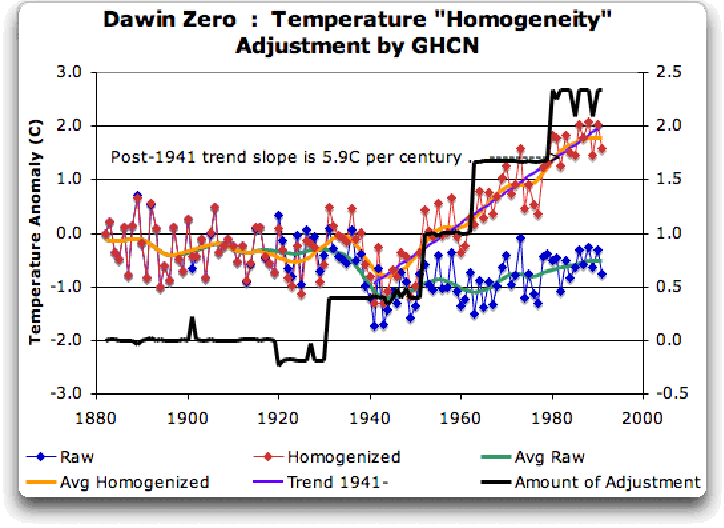
Figure 8 Darwin Zero Homogeneity Adjustments. Black line shows amount and timing of adjustments.
Yikes again, double yikes! What on earth justifies that adjustment? How can they do that? We have five different records covering Darwin from 1941 on. They all agree almost exactly. Why adjust them at all? They’ve just added a huge artificial totally imaginary trend to the last half of the raw data! Now it looks like the IPCC diagram in Figure 1, all right … but a six degree per century trend? And in the shape of a regular stepped pyramid climbing to heaven? What’s up with that?
Those, dear friends, are the clumsy fingerprints of someone messing with the data Egyptian style … they are indisputable evidence that the “homogenized” data has been changed to fit someone’s preconceptions about whether the earth is warming.
...Oh, and for what it’s worth, care to know the way that GISS deals with this problem? Well, they only use the Darwin data after 1963, a fine way of neatly avoiding the question … and also a fine way to throw away all of the inconveniently colder data prior to 1941. It’s likely a better choice than the GHCN monstrosity, but it’s a hard one to justify....
______
Full article here - I strongly encourage you to read it!!!
The Smoking Gun At Darwin Zero « Watts Up With That?
___
There are three main global temperature datasets. One is at the CRU, Climate Research Unit of the University of East Anglia, where we’ve been trying to get access to the raw numbers. One is at NOAA/GHCN, the Global Historical Climate Network. The final one is at NASA/GISS, the Goddard Institute for Space Studies. The three groups take raw data, and they “homogenize” it to remove things like when a station was moved to a warmer location and there’s a 2C jump in the temperature. The three global temperature records are usually called CRU, GISS, and GHCN. Both GISS and CRU, however, get almost all of their raw data from GHCN. All three produce very similar global historical temperature records from the raw data.
So I’m still on my multi-year quest to understand the climate data. You never know where this data chase will lead. This time, it has ended me up in Australia. I got to thinking about Professor Wibjorn Karlen’s statement about Australia that I quoted here:
Another example is Australia. NASA [GHCN] only presents 3 stations covering the period 1897-1992. What kind of data is the IPCC Australia diagram based on?
If any trend it is a slight cooling. However, if a shorter period (1949-2005) is used, the temperature has increased substantially. The Australians have many stations and have published more detailed maps of changes and trends.
The folks at CRU told Wibjorn that he was just plain wrong. Here’s what they said is right, the record that Wibjorn was talking about, Fig. 9.12 in the UN IPCC Fourth Assessment Report, showing Northern Australia:
Figure 1. Temperature trends and model results in Northern Australia. Black line is observations (From Fig. 9.12 from the UN IPCC Fourth Annual Report). Covers the area from 110E to 155E, and from 30S to 11S. Based on the CRU land temperature.) Data from the CRU.
...Then I went to look at what happens when the GHCN removes the “in-homogeneities” to “adjust” the data. Of the five raw datasets, the GHCN discards two, likely because they are short and duplicate existing longer records. The three remaining records are first “homogenized” and then averaged to give the “GHCN Adjusted” temperature record for Darwin.
To my great surprise, here’s what I found. To explain the full effect, I am showing this with both datasets starting at the same point (rather than ending at the same point as they are often shown).
...Intrigued by the curious shape of the average of the homogenized Darwin records, I then went to see how they had homogenized each of the individual station records. What made up that strange average shown in Fig. 7? I started at zero with the earliest record. Here is Station Zero at Darwin, showing the raw and the homogenized versions.
Figure 8 Darwin Zero Homogeneity Adjustments. Black line shows amount and timing of adjustments.
Yikes again, double yikes! What on earth justifies that adjustment? How can they do that? We have five different records covering Darwin from 1941 on. They all agree almost exactly. Why adjust them at all? They’ve just added a huge artificial totally imaginary trend to the last half of the raw data! Now it looks like the IPCC diagram in Figure 1, all right … but a six degree per century trend? And in the shape of a regular stepped pyramid climbing to heaven? What’s up with that?
Those, dear friends, are the clumsy fingerprints of someone messing with the data Egyptian style … they are indisputable evidence that the “homogenized” data has been changed to fit someone’s preconceptions about whether the earth is warming.
...Oh, and for what it’s worth, care to know the way that GISS deals with this problem? Well, they only use the Darwin data after 1963, a fine way of neatly avoiding the question … and also a fine way to throw away all of the inconveniently colder data prior to 1941. It’s likely a better choice than the GHCN monstrosity, but it’s a hard one to justify....
______
Full article here - I strongly encourage you to read it!!!
The Smoking Gun At Darwin Zero « Watts Up With That?
Last edited:


