Navigation
Install the app
How to install the app on iOS
Follow along with the video below to see how to install our site as a web app on your home screen.
Note: This feature may not be available in some browsers.
More options
You are using an out of date browser. It may not display this or other websites correctly.
You should upgrade or use an alternative browser.
You should upgrade or use an alternative browser.
Can Anyone Say Maunder Minimum?
- Thread starter Weatherman2020
- Start date
- Status
- Not open for further replies.
Sunsettommy
Diamond Member
- Mar 19, 2018
- 15,178
- 12,747
- 2,400
How about a link to a peer reviewed study supporting your null-hypothesis claim. I just posted an excerpt from an article that showed warming over the last century is taking placed at TEN TIMES the historical rate.
What article?
Here is the HadCrut3 Chart you already forgot from post 26:
Warming rates sticks at the .16C per Decade rate since 1860.
Sunsettommy
Diamond Member
- Mar 19, 2018
- 15,178
- 12,747
- 2,400
And there you go lying again. I actually said no cooling cycle the last 100 years, which would NOT include 1880 to 1900, and 1942 to 1978 is more FLAT than cooling to anyone who can see straight. If 1942 to 1978 were truly a cooling cycle rather than a flat cycle the lows of that period would have matched the 1880 to 1900 lows, and they don't. The flatness of that period is obvious in my MetOffice graph with the 5 year running average in solid black which is why you don't like it. And the HadCrut4 data is more accurate, which is why YOU prefer the HadCrut3 data.Notice how the dishonest Right have to change what I said and create a Straw Man to argue against!!!You fools have been predicting cooling since the 1970s, yet we have gone 100 years without a cooling cycle. We have warming, then flat, then warming, then flat, then warming. Each new warming cycle begins about where the previous warming cycle left off.
You mean the SCIENTISTS along with the media back in the 1960's and 70's were predicting cooling, which really did happen from the 1940's to the 1970's.
You claim is patently false as HadCRut temperature doesn't see it that way
From Dr. Jones BBC Interview showing warming and COOLING phases since the mid 1800's, the chart up to 2009 using HIS data:
View attachment 192908
All warming trends similar and well below the AGW mandated Per Decade trend of at least .30C
I said no cooling cycle for the last 100 years and to the Right 100 years ago was 1850.
Now your OWN chart shows warming, flat, warming over the last 100 years, so thank you for proving me correct.
BTW, your chart clearly was not made by the MetOffice.
Here is the real MetOffice chart;
Several things leap out at me when I read your misleading post:
1) Dr. Jones was the DIRECTOR of Climatic Research Unit (CRU)
2) The chart I posted was based on HIS data from, HadCrut3 shown in the interview you never read:
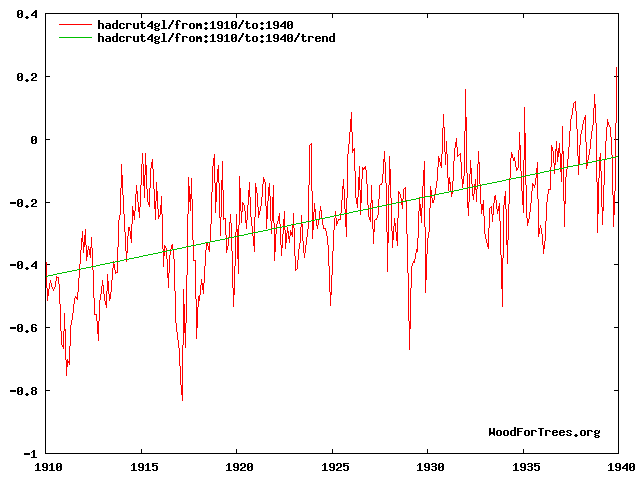
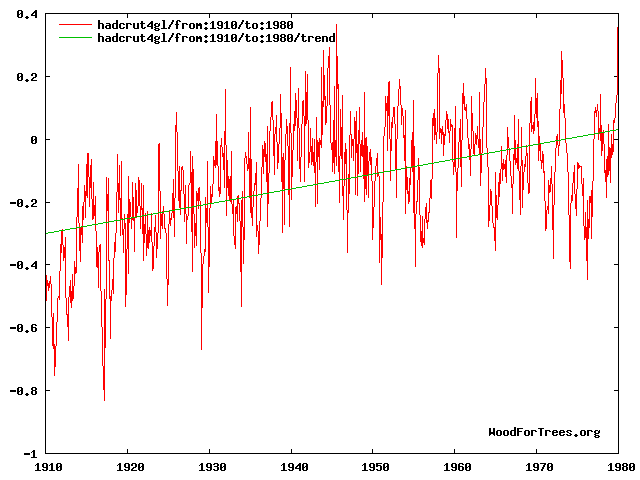
"A - Do you agree that according to the global temperature record used by the IPCC, the rates of global warming from 1860-1880, 1910-1940 and 1975-1998 were identical?
An initial point to make is that in the responses to these questions I've assumed that when you talk about the global temperature record, you mean the record that combines the estimates from land regions with those from the marine regions of the world. CRU produces the land component, with the Met Office Hadley Centre producing the marine component.
Temperature data for the period 1860-1880 are more uncertain, because of sparser coverage, than for later periods in the 20th Century. The 1860-1880 period is also only 21 years in length. As for the two periods 1910-40 and 1975-1998 the warming rates are not statistically significantly different (see numbers below).
I have also included the trend over the period 1975 to 2009, which has a very similar trend to the period 1975-1998.
So, in answer to the question, the warming rates for all 4 periods are similar and not statistically significantly different from each other.
Here are the trends and significances for each period:"
red bolding mine
in the 2009 interview he was using Hadcrut3 shown in the chart, where the obvious warming cooling cycles appear.
View attachment 192921
You never provided the link to your METOFFICE charts. Snicker............
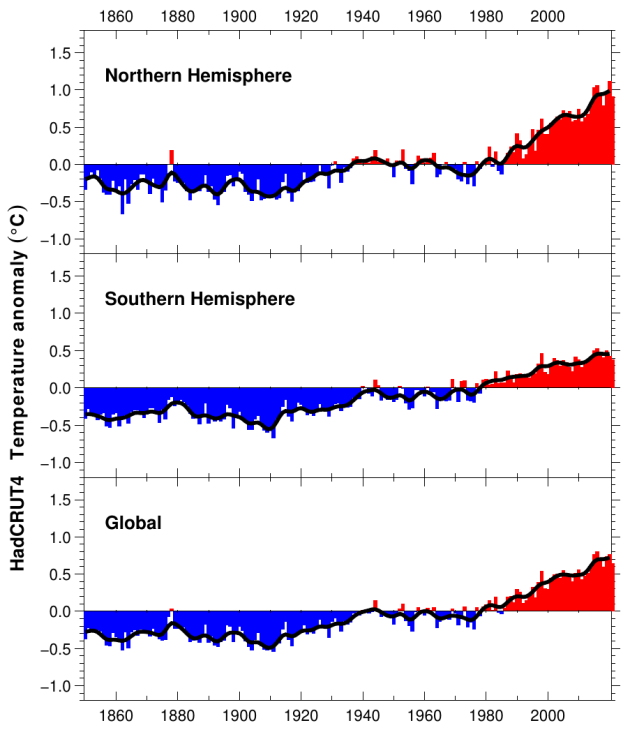
3) you idiotically claimed that the chart I posted shows no cooling periods in them. You are willing to lie to yourself here since those cooling periods are OBVIOUS! The cooling periods from 1880-1900 and 1942-1978 are well known and easily seen in the big chart I posted using HadCrut3 data.
Here is the link:
https://crudata.uea.ac.uk/cru/data/temperature/HadCRUT4.png

This is your actual statement:
"You fools have been predicting cooling since the 1970s, yet we have gone 100 years without a cooling cycle. We have warming, then flat, then warming, then flat, then warming. Each new warming cycle begins about where the previous warming cycle left off."
ALL datasets show some cooling periods in between the warming periods.
HadCrut3:
GISSTemp:
In both charts the 1940's is clearly warmer than the 1970's.
Don't continue to make a fool of yourself on this.
edthecynic
Censored for Cynicism
- Oct 20, 2008
- 43,044
- 6,883
- 1,830
But in both charts the 1970s never even come close to any of the previous lows of the last real cooling cycle before 1910. If you were honest you would call the period from 1940 to 1970 FLAT when compared to an actual cooling cycle. But you are not.And there you go lying again. I actually said no cooling cycle the last 100 years, which would NOT include 1880 to 1900, and 1942 to 1978 is more FLAT than cooling to anyone who can see straight. If 1942 to 1978 were truly a cooling cycle rather than a flat cycle the lows of that period would have matched the 1880 to 1900 lows, and they don't. The flatness of that period is obvious in my MetOffice graph with the 5 year running average in solid black which is why you don't like it. And the HadCrut4 data is more accurate, which is why YOU prefer the HadCrut3 data.Notice how the dishonest Right have to change what I said and create a Straw Man to argue against!!!You fools have been predicting cooling since the 1970s, yet we have gone 100 years without a cooling cycle. We have warming, then flat, then warming, then flat, then warming. Each new warming cycle begins about where the previous warming cycle left off.
You mean the SCIENTISTS along with the media back in the 1960's and 70's were predicting cooling, which really did happen from the 1940's to the 1970's.
You claim is patently false as HadCRut temperature doesn't see it that way
From Dr. Jones BBC Interview showing warming and COOLING phases since the mid 1800's, the chart up to 2009 using HIS data:
View attachment 192908
All warming trends similar and well below the AGW mandated Per Decade trend of at least .30C
I said no cooling cycle for the last 100 years and to the Right 100 years ago was 1850.
Now your OWN chart shows warming, flat, warming over the last 100 years, so thank you for proving me correct.
BTW, your chart clearly was not made by the MetOffice.
Here is the real MetOffice chart;
Several things leap out at me when I read your misleading post:
1) Dr. Jones was the DIRECTOR of Climatic Research Unit (CRU)
2) The chart I posted was based on HIS data from, HadCrut3 shown in the interview you never read:
"A - Do you agree that according to the global temperature record used by the IPCC, the rates of global warming from 1860-1880, 1910-1940 and 1975-1998 were identical?
An initial point to make is that in the responses to these questions I've assumed that when you talk about the global temperature record, you mean the record that combines the estimates from land regions with those from the marine regions of the world. CRU produces the land component, with the Met Office Hadley Centre producing the marine component.
Temperature data for the period 1860-1880 are more uncertain, because of sparser coverage, than for later periods in the 20th Century. The 1860-1880 period is also only 21 years in length. As for the two periods 1910-40 and 1975-1998 the warming rates are not statistically significantly different (see numbers below).
I have also included the trend over the period 1975 to 2009, which has a very similar trend to the period 1975-1998.
So, in answer to the question, the warming rates for all 4 periods are similar and not statistically significantly different from each other.
Here are the trends and significances for each period:"
red bolding mine
in the 2009 interview he was using Hadcrut3 shown in the chart, where the obvious warming cooling cycles appear.
View attachment 192921
You never provided the link to your METOFFICE charts. Snicker............
3) you idiotically claimed that the chart I posted shows no cooling periods in them. You are willing to lie to yourself here since those cooling periods are OBVIOUS! The cooling periods from 1880-1900 and 1942-1978 are well known and easily seen in the big chart I posted using HadCrut3 data.
Here is the link:
https://crudata.uea.ac.uk/cru/data/temperature/HadCRUT4.png
This is your actual statement:
"You fools have been predicting cooling since the 1970s, yet we have gone 100 years without a cooling cycle. We have warming, then flat, then warming, then flat, then warming. Each new warming cycle begins about where the previous warming cycle left off."
ALL datasets show some cooling periods in between the warming periods.
HadCrut3:
View attachment 194208
GISSTemp:
View attachment 194209
In both charts the 1940's is clearly warmer than the 1970's.
Don't continue to make a fool of yourself on this.
Sunsettommy
Diamond Member
- Mar 19, 2018
- 15,178
- 12,747
- 2,400
But in both charts the 1970s never even come close to any of the previous lows of the last real cooling cycle before 1910. If you were honest you would call the period from 1940 to 1970 FLAT when compared to an actual cooling cycle. But you are not.And there you go lying again. I actually said no cooling cycle the last 100 years, which would NOT include 1880 to 1900, and 1942 to 1978 is more FLAT than cooling to anyone who can see straight. If 1942 to 1978 were truly a cooling cycle rather than a flat cycle the lows of that period would have matched the 1880 to 1900 lows, and they don't. The flatness of that period is obvious in my MetOffice graph with the 5 year running average in solid black which is why you don't like it. And the HadCrut4 data is more accurate, which is why YOU prefer the HadCrut3 data.Notice how the dishonest Right have to change what I said and create a Straw Man to argue against!!!You mean the SCIENTISTS along with the media back in the 1960's and 70's were predicting cooling, which really did happen from the 1940's to the 1970's.
You claim is patently false as HadCRut temperature doesn't see it that way
From Dr. Jones BBC Interview showing warming and COOLING phases since the mid 1800's, the chart up to 2009 using HIS data:
View attachment 192908
All warming trends similar and well below the AGW mandated Per Decade trend of at least .30C
I said no cooling cycle for the last 100 years and to the Right 100 years ago was 1850.
Now your OWN chart shows warming, flat, warming over the last 100 years, so thank you for proving me correct.
BTW, your chart clearly was not made by the MetOffice.
Here is the real MetOffice chart;
Several things leap out at me when I read your misleading post:
1) Dr. Jones was the DIRECTOR of Climatic Research Unit (CRU)
2) The chart I posted was based on HIS data from, HadCrut3 shown in the interview you never read:
"A - Do you agree that according to the global temperature record used by the IPCC, the rates of global warming from 1860-1880, 1910-1940 and 1975-1998 were identical?
An initial point to make is that in the responses to these questions I've assumed that when you talk about the global temperature record, you mean the record that combines the estimates from land regions with those from the marine regions of the world. CRU produces the land component, with the Met Office Hadley Centre producing the marine component.
Temperature data for the period 1860-1880 are more uncertain, because of sparser coverage, than for later periods in the 20th Century. The 1860-1880 period is also only 21 years in length. As for the two periods 1910-40 and 1975-1998 the warming rates are not statistically significantly different (see numbers below).
I have also included the trend over the period 1975 to 2009, which has a very similar trend to the period 1975-1998.
So, in answer to the question, the warming rates for all 4 periods are similar and not statistically significantly different from each other.
Here are the trends and significances for each period:"
red bolding mine
in the 2009 interview he was using Hadcrut3 shown in the chart, where the obvious warming cooling cycles appear.
View attachment 192921
You never provided the link to your METOFFICE charts. Snicker............
3) you idiotically claimed that the chart I posted shows no cooling periods in them. You are willing to lie to yourself here since those cooling periods are OBVIOUS! The cooling periods from 1880-1900 and 1942-1978 are well known and easily seen in the big chart I posted using HadCrut3 data.
Here is the link:
https://crudata.uea.ac.uk/cru/data/temperature/HadCRUT4.png
This is your actual statement:
"You fools have been predicting cooling since the 1970s, yet we have gone 100 years without a cooling cycle. We have warming, then flat, then warming, then flat, then warming. Each new warming cycle begins about where the previous warming cycle left off."
ALL datasets show some cooling periods in between the warming periods.
HadCrut3:
View attachment 194208
GISSTemp:
View attachment 194209
In both charts the 1940's is clearly warmer than the 1970's.
Don't continue to make a fool of yourself on this.
Wow!
You are willing to lie to yourselves so openly.
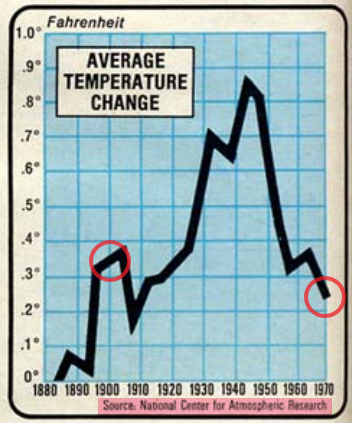
Here is NCAR chart back in 1974:
around .6 F drop.
I have more if you want to continue to lie about it
By the way I have not been talking about the PREVIOUS cooling cycle, just about the 1940's to the 1970's time period, which was a well known cooling period.
Stop trying to move the goalpost!
Sunsettommy
Diamond Member
- Mar 19, 2018
- 15,178
- 12,747
- 2,400
How about a link to a peer reviewed study supporting your null-hypothesis claim. I just posted an excerpt from an article that showed warming over the last century is taking placed at TEN TIMES the historical rate.
No you didn't because I already showed that all warming trends back to the 1860's are about .16C each time, as shown in post 26
Still waiting for your invisible article.
Sunsettommy
Diamond Member
- Mar 19, 2018
- 15,178
- 12,747
- 2,400
And there you go lying again. I actually said no cooling cycle the last 100 years, which would NOT include 1880 to 1900, and 1942 to 1978 is more FLAT than cooling to anyone who can see straight. If 1942 to 1978 were truly a cooling cycle rather than a flat cycle the lows of that period would have matched the 1880 to 1900 lows, and they don't. The flatness of that period is obvious in my MetOffice graph with the 5 year running average in solid black which is why you don't like it. And the HadCrut4 data is more accurate, which is why YOU prefer the HadCrut3 data.Notice how the dishonest Right have to change what I said and create a Straw Man to argue against!!!You fools have been predicting cooling since the 1970s, yet we have gone 100 years without a cooling cycle. We have warming, then flat, then warming, then flat, then warming. Each new warming cycle begins about where the previous warming cycle left off.
You mean the SCIENTISTS along with the media back in the 1960's and 70's were predicting cooling, which really did happen from the 1940's to the 1970's.
You claim is patently false as HadCRut temperature doesn't see it that way
From Dr. Jones BBC Interview showing warming and COOLING phases since the mid 1800's, the chart up to 2009 using HIS data:
View attachment 192908
All warming trends similar and well below the AGW mandated Per Decade trend of at least .30C
I said no cooling cycle for the last 100 years and to the Right 100 years ago was 1850.
Now your OWN chart shows warming, flat, warming over the last 100 years, so thank you for proving me correct.
BTW, your chart clearly was not made by the MetOffice.
Here is the real MetOffice chart;
Several things leap out at me when I read your misleading post:
1) Dr. Jones was the DIRECTOR of Climatic Research Unit (CRU)
2) The chart I posted was based on HIS data from, HadCrut3 shown in the interview you never read:
"A - Do you agree that according to the global temperature record used by the IPCC, the rates of global warming from 1860-1880, 1910-1940 and 1975-1998 were identical?
An initial point to make is that in the responses to these questions I've assumed that when you talk about the global temperature record, you mean the record that combines the estimates from land regions with those from the marine regions of the world. CRU produces the land component, with the Met Office Hadley Centre producing the marine component.
Temperature data for the period 1860-1880 are more uncertain, because of sparser coverage, than for later periods in the 20th Century. The 1860-1880 period is also only 21 years in length. As for the two periods 1910-40 and 1975-1998 the warming rates are not statistically significantly different (see numbers below).
I have also included the trend over the period 1975 to 2009, which has a very similar trend to the period 1975-1998.
So, in answer to the question, the warming rates for all 4 periods are similar and not statistically significantly different from each other.
Here are the trends and significances for each period:"
red bolding mine
in the 2009 interview he was using Hadcrut3 shown in the chart, where the obvious warming cooling cycles appear.
View attachment 192921
You never provided the link to your METOFFICE charts. Snicker............
3) you idiotically claimed that the chart I posted shows no cooling periods in them. You are willing to lie to yourself here since those cooling periods are OBVIOUS! The cooling periods from 1880-1900 and 1942-1978 are well known and easily seen in the big chart I posted using HadCrut3 data.
Here is the link:
https://crudata.uea.ac.uk/cru/data/temperature/HadCRUT4.png
This is your actual statement:
"You fools have been predicting cooling since the 1970s, yet we have gone 100 years without a cooling cycle. We have warming, then flat, then warming, then flat, then warming. Each new warming cycle begins about where the previous warming cycle left off."
ALL datasets show some cooling periods in between the warming periods.
HadCrut3:
View attachment 194208
GISSTemp:
View attachment 194209
In both charts the 1940's is clearly warmer than the 1970's.
Don't continue to make a fool of yourself on this.
Your cooling trend dropped temperatures, what, 0.1C in 30 years? Impressive. When global is back down to the 1880 level, give us a ring, eh.
Sunsettommy
Diamond Member
- Mar 19, 2018
- 15,178
- 12,747
- 2,400
And there you go lying again. I actually said no cooling cycle the last 100 years, which would NOT include 1880 to 1900, and 1942 to 1978 is more FLAT than cooling to anyone who can see straight. If 1942 to 1978 were truly a cooling cycle rather than a flat cycle the lows of that period would have matched the 1880 to 1900 lows, and they don't. The flatness of that period is obvious in my MetOffice graph with the 5 year running average in solid black which is why you don't like it. And the HadCrut4 data is more accurate, which is why YOU prefer the HadCrut3 data.Notice how the dishonest Right have to change what I said and create a Straw Man to argue against!!!You mean the SCIENTISTS along with the media back in the 1960's and 70's were predicting cooling, which really did happen from the 1940's to the 1970's.
You claim is patently false as HadCRut temperature doesn't see it that way
From Dr. Jones BBC Interview showing warming and COOLING phases since the mid 1800's, the chart up to 2009 using HIS data:
View attachment 192908
All warming trends similar and well below the AGW mandated Per Decade trend of at least .30C
I said no cooling cycle for the last 100 years and to the Right 100 years ago was 1850.
Now your OWN chart shows warming, flat, warming over the last 100 years, so thank you for proving me correct.
BTW, your chart clearly was not made by the MetOffice.
Here is the real MetOffice chart;
Several things leap out at me when I read your misleading post:
1) Dr. Jones was the DIRECTOR of Climatic Research Unit (CRU)
2) The chart I posted was based on HIS data from, HadCrut3 shown in the interview you never read:
"A - Do you agree that according to the global temperature record used by the IPCC, the rates of global warming from 1860-1880, 1910-1940 and 1975-1998 were identical?
An initial point to make is that in the responses to these questions I've assumed that when you talk about the global temperature record, you mean the record that combines the estimates from land regions with those from the marine regions of the world. CRU produces the land component, with the Met Office Hadley Centre producing the marine component.
Temperature data for the period 1860-1880 are more uncertain, because of sparser coverage, than for later periods in the 20th Century. The 1860-1880 period is also only 21 years in length. As for the two periods 1910-40 and 1975-1998 the warming rates are not statistically significantly different (see numbers below).
I have also included the trend over the period 1975 to 2009, which has a very similar trend to the period 1975-1998.
So, in answer to the question, the warming rates for all 4 periods are similar and not statistically significantly different from each other.
Here are the trends and significances for each period:"
red bolding mine
in the 2009 interview he was using Hadcrut3 shown in the chart, where the obvious warming cooling cycles appear.
View attachment 192921
You never provided the link to your METOFFICE charts. Snicker............
3) you idiotically claimed that the chart I posted shows no cooling periods in them. You are willing to lie to yourself here since those cooling periods are OBVIOUS! The cooling periods from 1880-1900 and 1942-1978 are well known and easily seen in the big chart I posted using HadCrut3 data.
Here is the link:
https://crudata.uea.ac.uk/cru/data/temperature/HadCRUT4.png
This is your actual statement:
"You fools have been predicting cooling since the 1970s, yet we have gone 100 years without a cooling cycle. We have warming, then flat, then warming, then flat, then warming. Each new warming cycle begins about where the previous warming cycle left off."
ALL datasets show some cooling periods in between the warming periods.
HadCrut3:
View attachment 194208
GISSTemp:
View attachment 194209
In both charts the 1940's is clearly warmer than the 1970's.
Don't continue to make a fool of yourself on this.
Your cooling trend dropped temperatures, what, 0.1C in 30 years? Impressive. When global is back down to the 1880 level, give us a ring, eh.
Why don't YOU post a quote showing that I deny that it has been warming since the 1800's, otherwise you are dishonest as usual.
I proved that it was cooling which your pal repeatedly idiotically denied.
Sunsettommy
Diamond Member
- Mar 19, 2018
- 15,178
- 12,747
- 2,400
And there you go lying again. I actually said no cooling cycle the last 100 years, which would NOT include 1880 to 1900, and 1942 to 1978 is more FLAT than cooling to anyone who can see straight. If 1942 to 1978 were truly a cooling cycle rather than a flat cycle the lows of that period would have matched the 1880 to 1900 lows, and they don't. The flatness of that period is obvious in my MetOffice graph with the 5 year running average in solid black which is why you don't like it. And the HadCrut4 data is more accurate, which is why YOU prefer the HadCrut3 data.Notice how the dishonest Right have to change what I said and create a Straw Man to argue against!!!You mean the SCIENTISTS along with the media back in the 1960's and 70's were predicting cooling, which really did happen from the 1940's to the 1970's.
You claim is patently false as HadCRut temperature doesn't see it that way
From Dr. Jones BBC Interview showing warming and COOLING phases since the mid 1800's, the chart up to 2009 using HIS data:
View attachment 192908
All warming trends similar and well below the AGW mandated Per Decade trend of at least .30C
I said no cooling cycle for the last 100 years and to the Right 100 years ago was 1850.
Now your OWN chart shows warming, flat, warming over the last 100 years, so thank you for proving me correct.
BTW, your chart clearly was not made by the MetOffice.
Here is the real MetOffice chart;
Several things leap out at me when I read your misleading post:
1) Dr. Jones was the DIRECTOR of Climatic Research Unit (CRU)
2) The chart I posted was based on HIS data from, HadCrut3 shown in the interview you never read:
"A - Do you agree that according to the global temperature record used by the IPCC, the rates of global warming from 1860-1880, 1910-1940 and 1975-1998 were identical?
An initial point to make is that in the responses to these questions I've assumed that when you talk about the global temperature record, you mean the record that combines the estimates from land regions with those from the marine regions of the world. CRU produces the land component, with the Met Office Hadley Centre producing the marine component.
Temperature data for the period 1860-1880 are more uncertain, because of sparser coverage, than for later periods in the 20th Century. The 1860-1880 period is also only 21 years in length. As for the two periods 1910-40 and 1975-1998 the warming rates are not statistically significantly different (see numbers below).
I have also included the trend over the period 1975 to 2009, which has a very similar trend to the period 1975-1998.
So, in answer to the question, the warming rates for all 4 periods are similar and not statistically significantly different from each other.
Here are the trends and significances for each period:"
red bolding mine
in the 2009 interview he was using Hadcrut3 shown in the chart, where the obvious warming cooling cycles appear.
View attachment 192921
You never provided the link to your METOFFICE charts. Snicker............
3) you idiotically claimed that the chart I posted shows no cooling periods in them. You are willing to lie to yourself here since those cooling periods are OBVIOUS! The cooling periods from 1880-1900 and 1942-1978 are well known and easily seen in the big chart I posted using HadCrut3 data.
Here is the link:
https://crudata.uea.ac.uk/cru/data/temperature/HadCRUT4.png
This is your actual statement:
"You fools have been predicting cooling since the 1970s, yet we have gone 100 years without a cooling cycle. We have warming, then flat, then warming, then flat, then warming. Each new warming cycle begins about where the previous warming cycle left off."
ALL datasets show some cooling periods in between the warming periods.
HadCrut3:
View attachment 194208
GISSTemp:
View attachment 194209
In both charts the 1940's is clearly warmer than the 1970's.
Don't continue to make a fool of yourself on this.
Your cooling trend dropped temperatures, what, 0.1C in 30 years? Impressive. When global is back down to the 1880 level, give us a ring, eh.
Still waiting for your invisible article.
edthecynic
Censored for Cynicism
- Oct 20, 2008
- 43,044
- 6,883
- 1,830
From about .39F to .24F is a .6F drop in denier math.But in both charts the 1970s never even come close to any of the previous lows of the last real cooling cycle before 1910. If you were honest you would call the period from 1940 to 1970 FLAT when compared to an actual cooling cycle. But you are not.And there you go lying again. I actually said no cooling cycle the last 100 years, which would NOT include 1880 to 1900, and 1942 to 1978 is more FLAT than cooling to anyone who can see straight. If 1942 to 1978 were truly a cooling cycle rather than a flat cycle the lows of that period would have matched the 1880 to 1900 lows, and they don't. The flatness of that period is obvious in my MetOffice graph with the 5 year running average in solid black which is why you don't like it. And the HadCrut4 data is more accurate, which is why YOU prefer the HadCrut3 data.Notice how the dishonest Right have to change what I said and create a Straw Man to argue against!!!
I said no cooling cycle for the last 100 years and to the Right 100 years ago was 1850.
Now your OWN chart shows warming, flat, warming over the last 100 years, so thank you for proving me correct.
BTW, your chart clearly was not made by the MetOffice.
Here is the real MetOffice chart;
Several things leap out at me when I read your misleading post:
1) Dr. Jones was the DIRECTOR of Climatic Research Unit (CRU)
2) The chart I posted was based on HIS data from, HadCrut3 shown in the interview you never read:
"A - Do you agree that according to the global temperature record used by the IPCC, the rates of global warming from 1860-1880, 1910-1940 and 1975-1998 were identical?
An initial point to make is that in the responses to these questions I've assumed that when you talk about the global temperature record, you mean the record that combines the estimates from land regions with those from the marine regions of the world. CRU produces the land component, with the Met Office Hadley Centre producing the marine component.
Temperature data for the period 1860-1880 are more uncertain, because of sparser coverage, than for later periods in the 20th Century. The 1860-1880 period is also only 21 years in length. As for the two periods 1910-40 and 1975-1998 the warming rates are not statistically significantly different (see numbers below).
I have also included the trend over the period 1975 to 2009, which has a very similar trend to the period 1975-1998.
So, in answer to the question, the warming rates for all 4 periods are similar and not statistically significantly different from each other.
Here are the trends and significances for each period:"
red bolding mine
in the 2009 interview he was using Hadcrut3 shown in the chart, where the obvious warming cooling cycles appear.
View attachment 192921
You never provided the link to your METOFFICE charts. Snicker............
3) you idiotically claimed that the chart I posted shows no cooling periods in them. You are willing to lie to yourself here since those cooling periods are OBVIOUS! The cooling periods from 1880-1900 and 1942-1978 are well known and easily seen in the big chart I posted using HadCrut3 data.
Here is the link:
https://crudata.uea.ac.uk/cru/data/temperature/HadCRUT4.png
This is your actual statement:
"You fools have been predicting cooling since the 1970s, yet we have gone 100 years without a cooling cycle. We have warming, then flat, then warming, then flat, then warming. Each new warming cycle begins about where the previous warming cycle left off."
ALL datasets show some cooling periods in between the warming periods.
HadCrut3:
View attachment 194208
GISSTemp:
View attachment 194209
In both charts the 1940's is clearly warmer than the 1970's.
Don't continue to make a fool of yourself on this.
Wow!
You are willing to lie to yourselves so openly.
Here is NCAR chart back in 1974:
View attachment 194293
around .6 F drop.
I have more if you want to continue to lie about it
By the way I have not been talking about the PREVIOUS cooling cycle, just about the 1940's to the 1970's time period, which was a well known cooling period.
Stop trying to move the goalpost!
BRILLIANT. A .15F drop is essentially FLAT.
edthecynic
Censored for Cynicism
- Oct 20, 2008
- 43,044
- 6,883
- 1,830
So a .1 cooling after a nearly .4 warming is essentially FLAT!
From your own source:
Sunsettommy
Diamond Member
- Mar 19, 2018
- 15,178
- 12,747
- 2,400
From about .39F to .24F is a .6F drop in denier math.But in both charts the 1970s never even come close to any of the previous lows of the last real cooling cycle before 1910. If you were honest you would call the period from 1940 to 1970 FLAT when compared to an actual cooling cycle. But you are not.And there you go lying again. I actually said no cooling cycle the last 100 years, which would NOT include 1880 to 1900, and 1942 to 1978 is more FLAT than cooling to anyone who can see straight. If 1942 to 1978 were truly a cooling cycle rather than a flat cycle the lows of that period would have matched the 1880 to 1900 lows, and they don't. The flatness of that period is obvious in my MetOffice graph with the 5 year running average in solid black which is why you don't like it. And the HadCrut4 data is more accurate, which is why YOU prefer the HadCrut3 data.Several things leap out at me when I read your misleading post:
1) Dr. Jones was the DIRECTOR of Climatic Research Unit (CRU)
2) The chart I posted was based on HIS data from, HadCrut3 shown in the interview you never read:
"A - Do you agree that according to the global temperature record used by the IPCC, the rates of global warming from 1860-1880, 1910-1940 and 1975-1998 were identical?
An initial point to make is that in the responses to these questions I've assumed that when you talk about the global temperature record, you mean the record that combines the estimates from land regions with those from the marine regions of the world. CRU produces the land component, with the Met Office Hadley Centre producing the marine component.
Temperature data for the period 1860-1880 are more uncertain, because of sparser coverage, than for later periods in the 20th Century. The 1860-1880 period is also only 21 years in length. As for the two periods 1910-40 and 1975-1998 the warming rates are not statistically significantly different (see numbers below).
I have also included the trend over the period 1975 to 2009, which has a very similar trend to the period 1975-1998.
So, in answer to the question, the warming rates for all 4 periods are similar and not statistically significantly different from each other.
Here are the trends and significances for each period:"
red bolding mine
in the 2009 interview he was using Hadcrut3 shown in the chart, where the obvious warming cooling cycles appear.
View attachment 192921
You never provided the link to your METOFFICE charts. Snicker............
3) you idiotically claimed that the chart I posted shows no cooling periods in them. You are willing to lie to yourself here since those cooling periods are OBVIOUS! The cooling periods from 1880-1900 and 1942-1978 are well known and easily seen in the big chart I posted using HadCrut3 data.
Here is the link:
https://crudata.uea.ac.uk/cru/data/temperature/HadCRUT4.png
This is your actual statement:
"You fools have been predicting cooling since the 1970s, yet we have gone 100 years without a cooling cycle. We have warming, then flat, then warming, then flat, then warming. Each new warming cycle begins about where the previous warming cycle left off."
ALL datasets show some cooling periods in between the warming periods.
HadCrut3:
View attachment 194208
GISSTemp:
View attachment 194209
In both charts the 1940's is clearly warmer than the 1970's.
Don't continue to make a fool of yourself on this.
Wow!
You are willing to lie to yourselves so openly.
Here is NCAR chart back in 1974:
View attachment 194293
around .6 F drop.
I have more if you want to continue to lie about it
By the way I have not been talking about the PREVIOUS cooling cycle, just about the 1940's to the 1970's time period, which was a well known cooling period.
Stop trying to move the goalpost!
BRILLIANT. A .15F drop is essentially FLAT.
From post 105
.9F to .3F is indeed a .6F drop.
I have been talking about a cooling from the 1940's to the 1970's all along.
You have serious visual problems that needs to be addressed.
Last edited:
Sunsettommy
Diamond Member
- Mar 19, 2018
- 15,178
- 12,747
- 2,400
So a .1 cooling after a nearly .4 warming is essentially FLAT!
From your own source:
Your dishonesty knows no bounds, since I NEVER said 1910-1940 was a cooling trend. Heck I actually SHOWED that it was a warming trend of .15C from 1910-1940 earlier in the thread at post 26
Your feeble Red Herring here is dumb and boring.
What planet are you on?
Last edited:
edthecynic
Censored for Cynicism
- Oct 20, 2008
- 43,044
- 6,883
- 1,830
That's is NOT what you circled in red on your FAKE graph.From about .39F to .24F is a .6F drop in denier math.But in both charts the 1970s never even come close to any of the previous lows of the last real cooling cycle before 1910. If you were honest you would call the period from 1940 to 1970 FLAT when compared to an actual cooling cycle. But you are not.And there you go lying again. I actually said no cooling cycle the last 100 years, which would NOT include 1880 to 1900, and 1942 to 1978 is more FLAT than cooling to anyone who can see straight. If 1942 to 1978 were truly a cooling cycle rather than a flat cycle the lows of that period would have matched the 1880 to 1900 lows, and they don't. The flatness of that period is obvious in my MetOffice graph with the 5 year running average in solid black which is why you don't like it. And the HadCrut4 data is more accurate, which is why YOU prefer the HadCrut3 data.
Here is the link:
https://crudata.uea.ac.uk/cru/data/temperature/HadCRUT4.png
This is your actual statement:
"You fools have been predicting cooling since the 1970s, yet we have gone 100 years without a cooling cycle. We have warming, then flat, then warming, then flat, then warming. Each new warming cycle begins about where the previous warming cycle left off."
ALL datasets show some cooling periods in between the warming periods.
HadCrut3:
View attachment 194208
GISSTemp:
View attachment 194209
In both charts the 1940's is clearly warmer than the 1970's.
Don't continue to make a fool of yourself on this.
Wow!
You are willing to lie to yourselves so openly.
Here is NCAR chart back in 1974:
View attachment 194293
around .6 F drop.
I have more if you want to continue to lie about it
By the way I have not been talking about the PREVIOUS cooling cycle, just about the 1940's to the 1970's time period, which was a well known cooling period.
Stop trying to move the goalpost!
BRILLIANT. A .15F drop is essentially FLAT.
From post 105
.9F to .3F is indeed a .6F drop.
You have serious visual problems that needs to be addressed.
So lets put the two graphs from your linked source together and see if your minimal "cooling" completely offsets the warming that started in 1910 by .6F as your fake graph shows.
As can easily be seen, NONE of the lowest lows of the FLAT "cooling" period are even close to the warm run up, but many of the highest highs of your FLAT "cooling" period are very close to the highest high in the warm run up.
Last edited:
edthecynic
Censored for Cynicism
- Oct 20, 2008
- 43,044
- 6,883
- 1,830
And there you go again, creating a Straw Man to argue against rather than admit your "cooling" trend was essentially FLAT.So a .1 cooling after a nearly .4 warming is essentially FLAT!
From your own source:
Your dishonesty knows no bounds, since I NEVER said 1910-1940 was a cooling trend. Heck I actually SHOWED that it was a warming trend of .15C from 1910-1940 earlier in the thread at post 26
Your feeble Red Herring here is dumb and boring.
What planet are you on?
Thank you.
Sunsettommy
Diamond Member
- Mar 19, 2018
- 15,178
- 12,747
- 2,400
That's is NOT what you circled in red on your FAKE graph.From about .39F to .24F is a .6F drop in denier math.But in both charts the 1970s never even come close to any of the previous lows of the last real cooling cycle before 1910. If you were honest you would call the period from 1940 to 1970 FLAT when compared to an actual cooling cycle. But you are not.This is your actual statement:
"You fools have been predicting cooling since the 1970s, yet we have gone 100 years without a cooling cycle. We have warming, then flat, then warming, then flat, then warming. Each new warming cycle begins about where the previous warming cycle left off."
ALL datasets show some cooling periods in between the warming periods.
HadCrut3:
View attachment 194208
GISSTemp:
View attachment 194209
In both charts the 1940's is clearly warmer than the 1970's.
Don't continue to make a fool of yourself on this.
Wow!
You are willing to lie to yourselves so openly.
Here is NCAR chart back in 1974:
View attachment 194293
around .6 F drop.
I have more if you want to continue to lie about it
By the way I have not been talking about the PREVIOUS cooling cycle, just about the 1940's to the 1970's time period, which was a well known cooling period.
Stop trying to move the goalpost!
BRILLIANT. A .15F drop is essentially FLAT.
From post 105
.9F to .3F is indeed a .6F drop.
You have serious visual problems that needs to be addressed.
So lets put the two graphs from your linked together and see if your minimal "cooling" completely offsets the warming that started in 1910 as your fake graph shows.
As can easily be seen, NONE of the lowest lows of the FLAT "cooling" period are even close to the warm run up, but many of the highest highs of your FLAT "cooling" period are very close to the highest high in the warm run up.
You have serious problems since the 1974 chart is from NCAR which was the official temperature data of the day written up by Dr. Murray.
That you keep posting Red Herrings since I was ALWAYS talking about the time period from the 1940's to the 1970's.
I didn't make those Red circles or discussed them at all.
Said NOTHING about 1900-1988 or 1900-1940 either.
You are moving all over the place, trying so hard to eliminate a cooling trend from the 1940's to the 1970's, which I have been talking about all along. It is clear that cooling event which was real bothers you so much.
You are being a dishonest fool for this.
Sunsettommy
Diamond Member
- Mar 19, 2018
- 15,178
- 12,747
- 2,400
And there you go again, creating a Straw Man to argue against rather than admit your "cooling" trend was essentially FLAT.So a .1 cooling after a nearly .4 warming is essentially FLAT!
From your own source:
Your dishonesty knows no bounds, since I NEVER said 1910-1940 was a cooling trend. Heck I actually SHOWED that it was a warming trend of .15C from 1910-1940 earlier in the thread at post 26
Your feeble Red Herring here is dumb and boring.
What planet are you on?
Thank you.
It is clear you are a trolling, which will be reported since you are moving the goalpost all over the place with various dates that I never brought up.
edthecynic
Censored for Cynicism
- Oct 20, 2008
- 43,044
- 6,883
- 1,830
Your chart is from a denier blog and does not match the graph below directly from the NCAR/UCAR site.You have serious problems since the 1974 chart is from NCAR which was the official temperature data of the day written up by Dr. Murray.

Your fake graph:
flacaltenn
Diamond Member
None of this is pertinent to the Title and Topic of the thread. And it's been beat to death too many times before.
Gotta stay on the ORIGINAL topic of the threads in Zone2. This is too long of a "diversion". Closed.
Gotta stay on the ORIGINAL topic of the threads in Zone2. This is too long of a "diversion". Closed.
- Status
- Not open for further replies.
Similar threads
- Replies
- 315
- Views
- 3K
- Replies
- 100
- Views
- 2K
- Replies
- 83
- Views
- 2K
Latest Discussions
- Replies
- 228
- Views
- 2K
- Replies
- 67
- Views
- 464
Forum List
-
-
-
-
-
Political Satire 8885
-
-
-
-
-
-
-
-
-
-
-
-
-
-
-
-
-
-
-
ObamaCare 781
-
-
-
-
-
-
-
-
-
-
-
Member Usernotes 492
-
-
-
-
-
-
-
-
-
-