Sunsettommy
Diamond Member
- Mar 19, 2018
- 14,903
- 12,532
- 2,400
Your headline claims that sea ice has not fallen in "more than 10 years". Even YOUR data does not support that claim.
I didn't make the headline and you still don't address post one which means you haven't showed where it is wrong.
Your chart uses the following from YOUR link:
"Figure 1. Cumulative Mass Balance of Greenland and Antarctica, 1992–2020"
I am talking about from 2008 onward when it STOPPED declining your legendary dishonest claims exploding in your lying face because you don't address the chart properly which shows an obvious decline from 1980 which I never disputed you idiot!
I wrote what your fake eyes can't read,
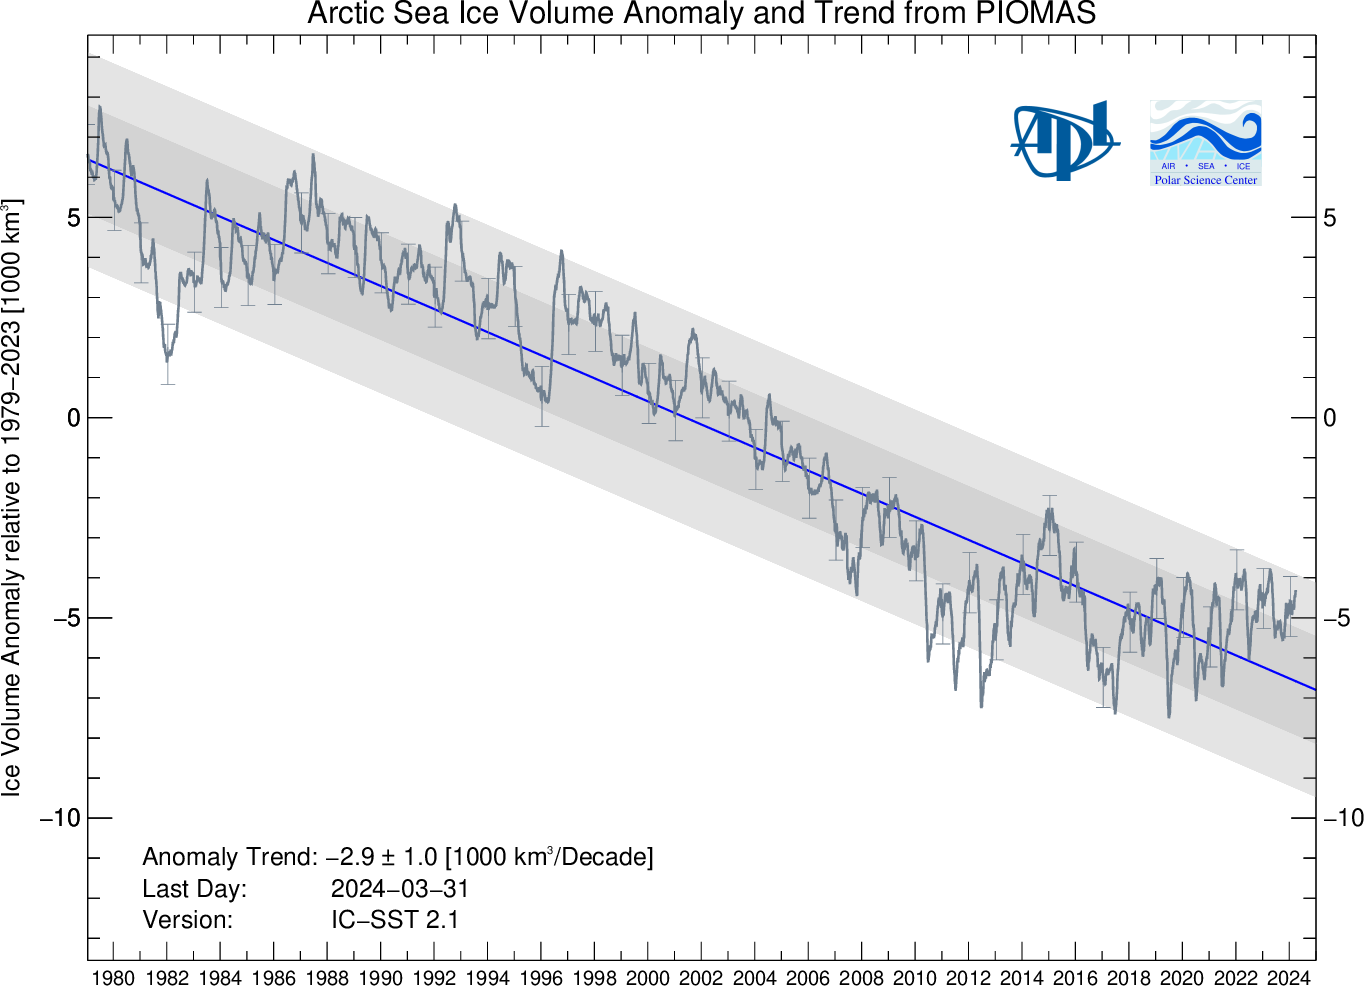
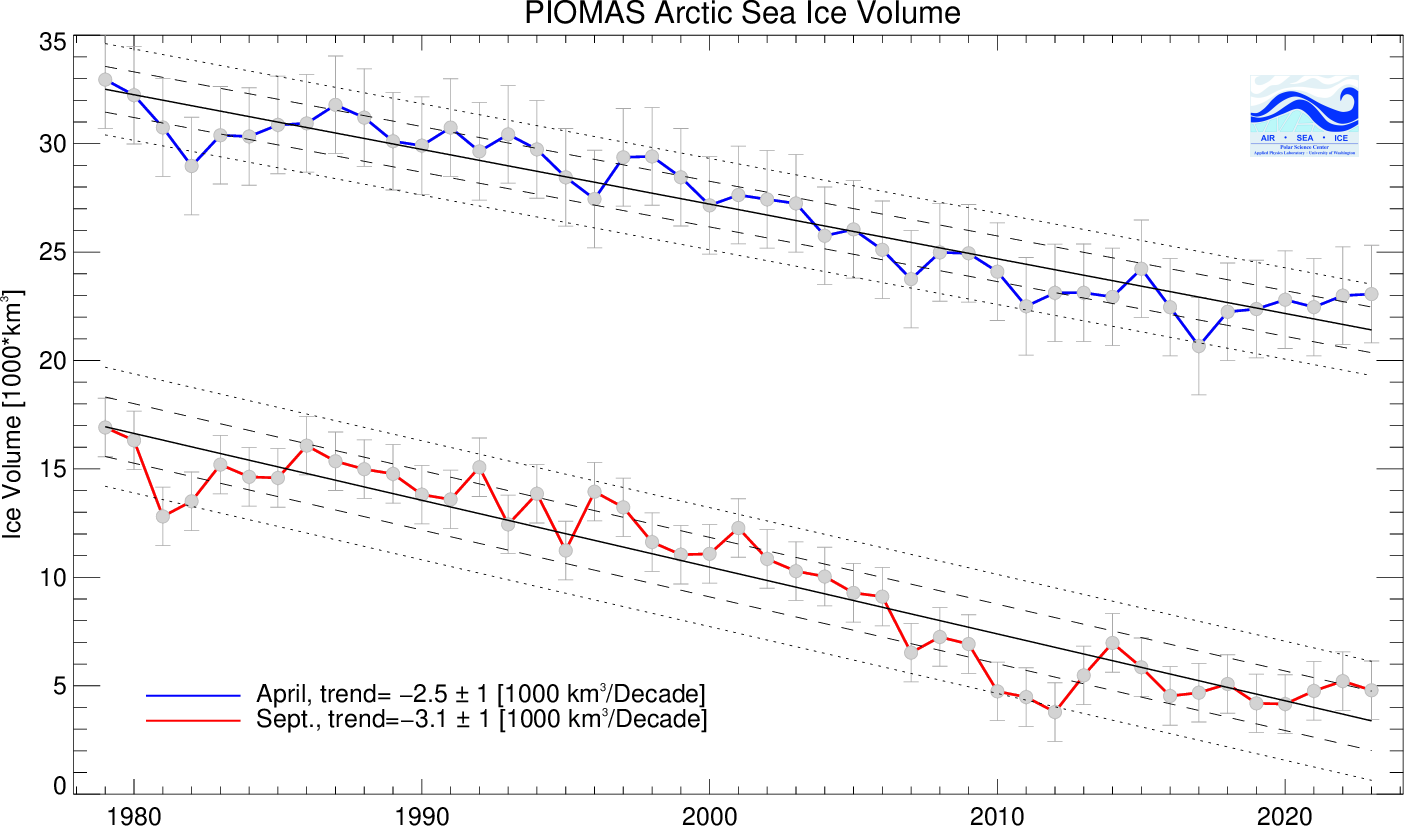
"Yes, I know what it is and just like the other TWO charts shows no decline since around 2008 by area and by volume but clearly at a lower level than in 1980."
Here is the NSIDC sea ice chart:
MASIE chart,
LINK
You should stop now since you are getting a hard factual beating since I have shown in three ways that the decline stopped around the 2008 year.
Last edited: