All Of Paraguay’s Temperature Record Has Been Tampered With

Ah yes, the whole of the scientific structure in the world is fraudulent, and we can only trust anonymous posters on the internet to tell the truth. Need a donation for more tinfoil for your hats?


Are you going to address the question or merely spew ad-homs?
 
Don't have to address the question. We have a debate as to what has actually happened with those records. I do not have adaquete information concerning the debate, so I look at the credentials of those in the debate. Right now, I have far more trust in the scientists at NOAA than I do for the author of the critisism. Or you, for that matter.

By the way, what the hell happened to all that cooling you have been predicting for the last five years. 1998, 2005, 2010, 2014, the very hot years are getting closer together, and coming even on ENSO neutral years.


Ah yes, the ever popular appeal to authority. All the while ignoring that the "authority" benefits from the alteration.

So, I guess you think that murderer's should prosecute their cases to don't ya!
 
a few days ago I posted up some temp stations from Paraquay to show that the hotspot in south america that is part of the 'hottest year evah' were in fact warmer only because of adjustments.

Paul Homewood has investigated all of the stations in Paraquay now, and they all follow the same pattern.

a few more examples -

pilar_thumb.gif
juan_thumb.gif
concepcion_thumb.gif


GISS and NOAA have yet to respond. what do you think is more likely? an open and transparent explanation of the 'correction'? or a disappearance of the past data? judging how past information and intermediate calculation steps have been vanishing over the last few years I am betting that even more stonewalling is about to occur.

hopefully some influential media outlets will give this story enough public exposure that this problem will have to be investigated.

All Of Paraguay rsquo s Temperature Record Has Been Tampered With NOT A LOT OF PEOPLE KNOW THAT

You mean like how 2014 was the hottest year on record according to 33% of "scientists"?
 
Ah yes, the ever popular appeal to authority. All the while ignoring that the "authority" benefits from the alteration.

So, I guess you think that murderer's should prosecute their cases to don't ya!

You realize that if you believe Paraguay's original temperature record was accurate, then you believe there was an unexplained spot of air colder than all the rest of South American, for years - confining itself sharply to its boundaries - with two extreme cold spikes, that all of which occurred nowhere else in the region.

And they accuse us of suspending disbelief.
 
here is the video-


puegif_thumb.gif


00:32 for adjusted, 00:52 for raw
 
Last edited:
there are lots of questions to be asked after this video is watched. I would have prefered that GISS data was used so that it was an apples to apples comparison but we must work with what we have.

the drop in 1970 was certainly less than the rise in 1993. one is removed and the other is not.

I cannot believe the hubris of Cowtan when he basically says that, yes the numbers have been dramatically altered but they need to match the trends in other countries and the world in general. he then adds the 'small portion of the world' excuse that is so popular to exclude USA data. every time someone looks at any particular part of the globe they find the same thing, massively adjusted data. and everytime we are told it doesnt matter because it is just one incident. howmany incidents must be shown before it matters? Iceland had a decade of cool weather 'removed' from history despite the fact that it had a large economic impact and was documented in history books.

there are many other nuances to Cowtan's video that I really dont have time to get to. one more example. he talks about the 10% adjustment from raw in the last 50 years. especially for global temps what is the adjustment for the last 100 years? or back to 1900, or 1880? the period around 1960 is the pivot point where adjustments change from adding to the recent temps to subtracting from the older temps. if there is 10% added to the trend since 1965, there is at least another 10% added to the trend before then by lowering older temps. even a 20% total adjustment sounds low to me but it is certainly large enough to matter.


slightly off topic. unintentional consequences are often the most informative in pointing out flaws. recently I pointed out that the CET (central england temperature) series had risen across the entire length of the three hundred year history. no trend change, just the whole thing was getting warmer (at a 2C/century clip but the only two points were about 1 1/2 years apart). I find this facinating because I dont think anyone is trying to manipulate this data. I think the change was accidentally introduced from elsewhere. finding the source may be very instructive as to how all of these unsupervised turnkey computer algorithms are producing results that are not quite right.
 
Don't have to address the question. We have a debate as to what has actually happened with those records. I do not have adaquete information concerning the debate, so I look at the credentials of those in the debate. Right now, I have far more trust in the scientists at NOAA than I do for the author of the critisism. Or you, for that matter.

By the way, what the hell happened to all that cooling you have been predicting for the last five years. 1998, 2005, 2010, 2014, the very hot years are getting closer together, and coming even on ENSO neutral years.


Ah yes, the ever popular appeal to authority. All the while ignoring that the "authority" benefits from the alteration.

So, I guess you think that murderer's should prosecute their cases to don't ya!
Michale Mann and Phil Jones both got to tell their peers, who were investigating them for gross misconduct, what evidence was really relevant.... and what evidence was to be ignored...

This is a kin to a man who committed murder and was then asked by the prosecutors if they could include the gun as evidence... The stupid, It burns... Oh IT BURNS!
 
You seem to assume guilty before the "trial" and that the accused have no right to self-defense.
 
there are lots of questions to be asked after this video is watched. I would have prefered that GISS data was used so that it was an apples to apples comparison but we must work with what we have.

the drop in 1970 was certainly less than the rise in 1993. one is removed and the other is not.

I cannot believe the hubris of Cowtan when he basically says that, yes the numbers have been dramatically altered but they need to match the trends in other countries and the world in general. he then adds the 'small portion of the world' excuse that is so popular to exclude USA data. every time someone looks at any particular part of the globe they find the same thing, massively adjusted data. and everytime we are told it doesnt matter because it is just one incident. howmany incidents must be shown before it matters? Iceland had a decade of cool weather 'removed' from history despite the fact that it had a large economic impact and was documented in history books.

there are many other nuances to Cowtan's video that I really dont have time to get to. one more example. he talks about the 10% adjustment from raw in the last 50 years. especially for global temps what is the adjustment for the last 100 years? or back to 1900, or 1880? the period around 1960 is the pivot point where adjustments change from adding to the recent temps to subtracting from the older temps. if there is 10% added to the trend since 1965, there is at least another 10% added to the trend before then by lowering older temps. even a 20% total adjustment sounds low to me but it is certainly large enough to matter.


slightly off topic. unintentional consequences are often the most informative in pointing out flaws. recently I pointed out that the CET (central england temperature) series had risen across the entire length of the three hundred year history. no trend change, just the whole thing was getting warmer (at a 2C/century clip but the only two points were about 1 1/2 years apart). I find this facinating because I dont think anyone is trying to manipulate this data. I think the change was accidentally introduced from elsewhere. finding the source may be very instructive as to how all of these unsupervised turnkey computer algorithms are producing results that are not quite right.

Where did you get the impression that this process was turnkey?


what gives you the impression it is not turnkey? no, really. what part of the homogenization process do you think is under human oversight?
 
I certainly wish this story would get more media attention. perhaps it still might before it drifts away like all the ones previous.

Forget Climategate this global warming scandal is much bigger - Breitbart

what's the latest from Homewood? remember how Cowtan said Paraguay was adjusted to match its neighbours? well, Bolivia is a direct neighbour, how do you think its temp record looks? now you're catching on. it's turtles all the way down. and by turtles I mean adjustments.

30285154000_thumb.gif

30285201000_thumb.gif

30285043000_thumb.gif


in the video Cowtan said the dip in 1970 was only in Paraguay so it needed to be fixed, and Crick repeated it. others like Hawkins said it must have been a station move. so why do so many other stations have the same dip, in different countries that were supposedly used to distinguish the exception in Paraguay?

more at Cooling The Past In Bolivia NOT A LOT OF PEOPLE KNOW THAT

why do posters like Crick so easily believe lame excuses for these things? there may be defensible reasons for the adjustments but the interested public doesnt get them. whether it is Reykjavik Iceland, Lulay Texas or Puerto Casado Paraguay, all we get is 'trust us, we're the experts'. if everything is in order then suspicions will be allayed. if there are problems then we will finally be on the way to identifying and fixing them.
 
speaking of reykjavik- here is a GHCN graph from Feb 2014

reykjavik_62004030000_thumb.gif


and here is the graph from 17Jan2014

reykjovik_2015_62004030000_thumb.gif


the yellow graph in the middle on the right hand side shows the trend over the last 100+ years. in less than a year it has gone from well under 2C to exactly 2C. quite the change, eh?

well thats not exactly the whole story. you see there is also a 29Jan2015 version

reykjovik_jan29_2015_62004030000_thumb.gif


in less than 2 weeks the trend has gone from 2C to well over 2C!!!


tell me again how these jokers know the Global Temp down to hundredths or thousandths of a degree, and are willing to proclaim a 'new record' by 0.02C when seemingly every station fluxuates wildly every year, and sometimes within a few weeks.
 
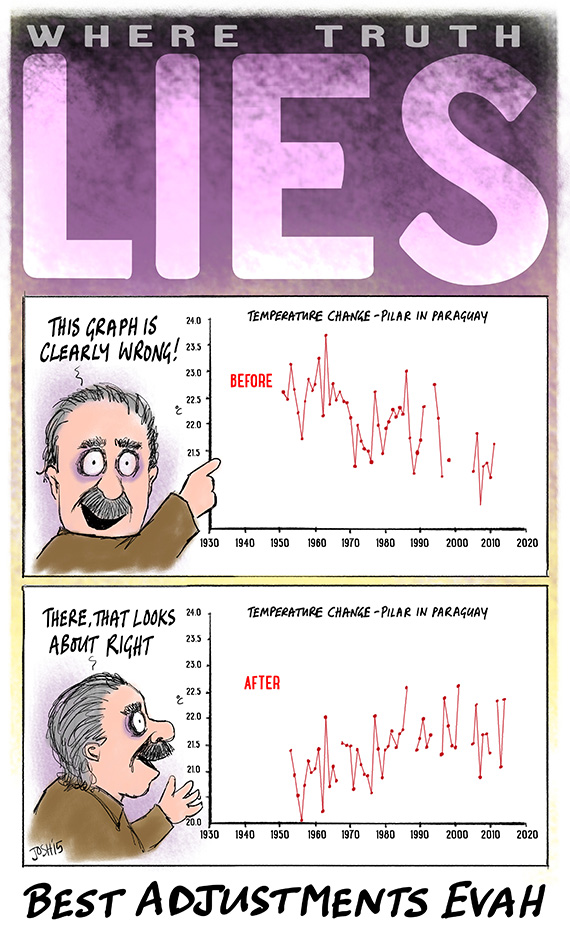
Where_Truth_Lies_scr.jpg


good ol' Muller

157441-TAVG-Raw.png


157441-TAVG-Alignment.png


157441-TAVG-Comparison.png


"
Mean Rate of Change ( °C / Century )
Raw monthly anomalies -2.19
After quality control -1.98
After breakpoint alignment 1.14
Regional expectation during same months 1.21 ± 0.35
National average during same months 1.29 ± 0.39
Global land average during same months 1.79 ± 0.08
"

hmmmm......minus 2C/century goes to plus 1C/century. that's some pretty robust adjustin'

(edit for crick- notice yet another drop in temps at 1970?)
 
hahahahahaha

here's another one for you crick. remember when I said these global dataset agencies should hire an accounting firm to clean up their data?

here is NOAA's location page for Pilar.

Historical Observing Metadata Repository HOMR National Climatic Data Center

not only do they have Pilar listed as part of Argentina but the gps location seems to be in the middle of the Rio Paraguay. Pilar may be rural anyway but if they were using night light brightness to classify it, they would get the wrong answer.


edit- there is in fact a Pilar, Argentina. population 300,000. but it certainly isnt at NOAA's location!
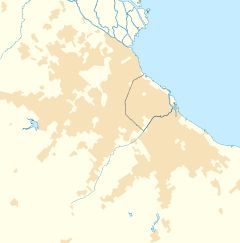
240px-Argentina_Greater_Buenos_Aires_location_map.svg.png

Location in Greater Buenos Aires
Coordinates:
17px-WMA_button2b.png
34°27′S 58°55′W
 
Last edited:
hahahahahaha

here's another one for you crick. remember when I said these global dataset agencies should hire an accounting firm to clean up their data?

here is NOAA's location page for Pilar.

Historical Observing Metadata Repository HOMR National Climatic Data Center

not only do they have Pilar listed as part of Argentina but the gps location seems to be in the middle of the Rio Paraguay. Pilar may be rural anyway but if they were using night light brightness to classify it, they would get the wrong answer.


edit- there is in fact a Pilar, Argentina. population 300,000. but it certainly isnt at NOAA's location!
240px-Argentina_Greater_Buenos_Aires_location_map.svg.png

Location in Greater Buenos Aires
Coordinates:
17px-WMA_button2b.png
34°27′S 58°55′W


Well, you know.....any old data set will do.. It's not like they are going to leave it alone. After they've "massaged" it a bit, the data will tell you it's Hawaii hot.
 
Homewood has yet another posting up about the travesty of the Paraguayan adjustments. there are two rural stations within 700km of Puerto Casado. one shows the usual adjustment from cooling trend to warming trend (and a big drop around 1970) and the other is three clumps of data with big gaps in between.

Paraguayan Adjustments Not Supported By Regional Trends NOT A LOT OF PEOPLE KNOW THAT

but we are being told that the adjustments are being made to bring the 'outlier Paraguay back into line with the rest of the region'.

speaking of which, I have repeatedly tried to get across the idea that BEST algorithms simply chop up the raw data and put it together in a fashion that matches 'what they expect'.

157441-TAVG-Comparison.png


here they have chopped Pilar's record into 8 pieces and magically recreated what they wanted to find. empirical breaks, not station moves, not documented instrument changes. the algorithm says chop and that's what they do.

check it out for yourself! go to Berkeley Earth and look up any station you want. they all end up meeting regional expectations. how could they not?
 
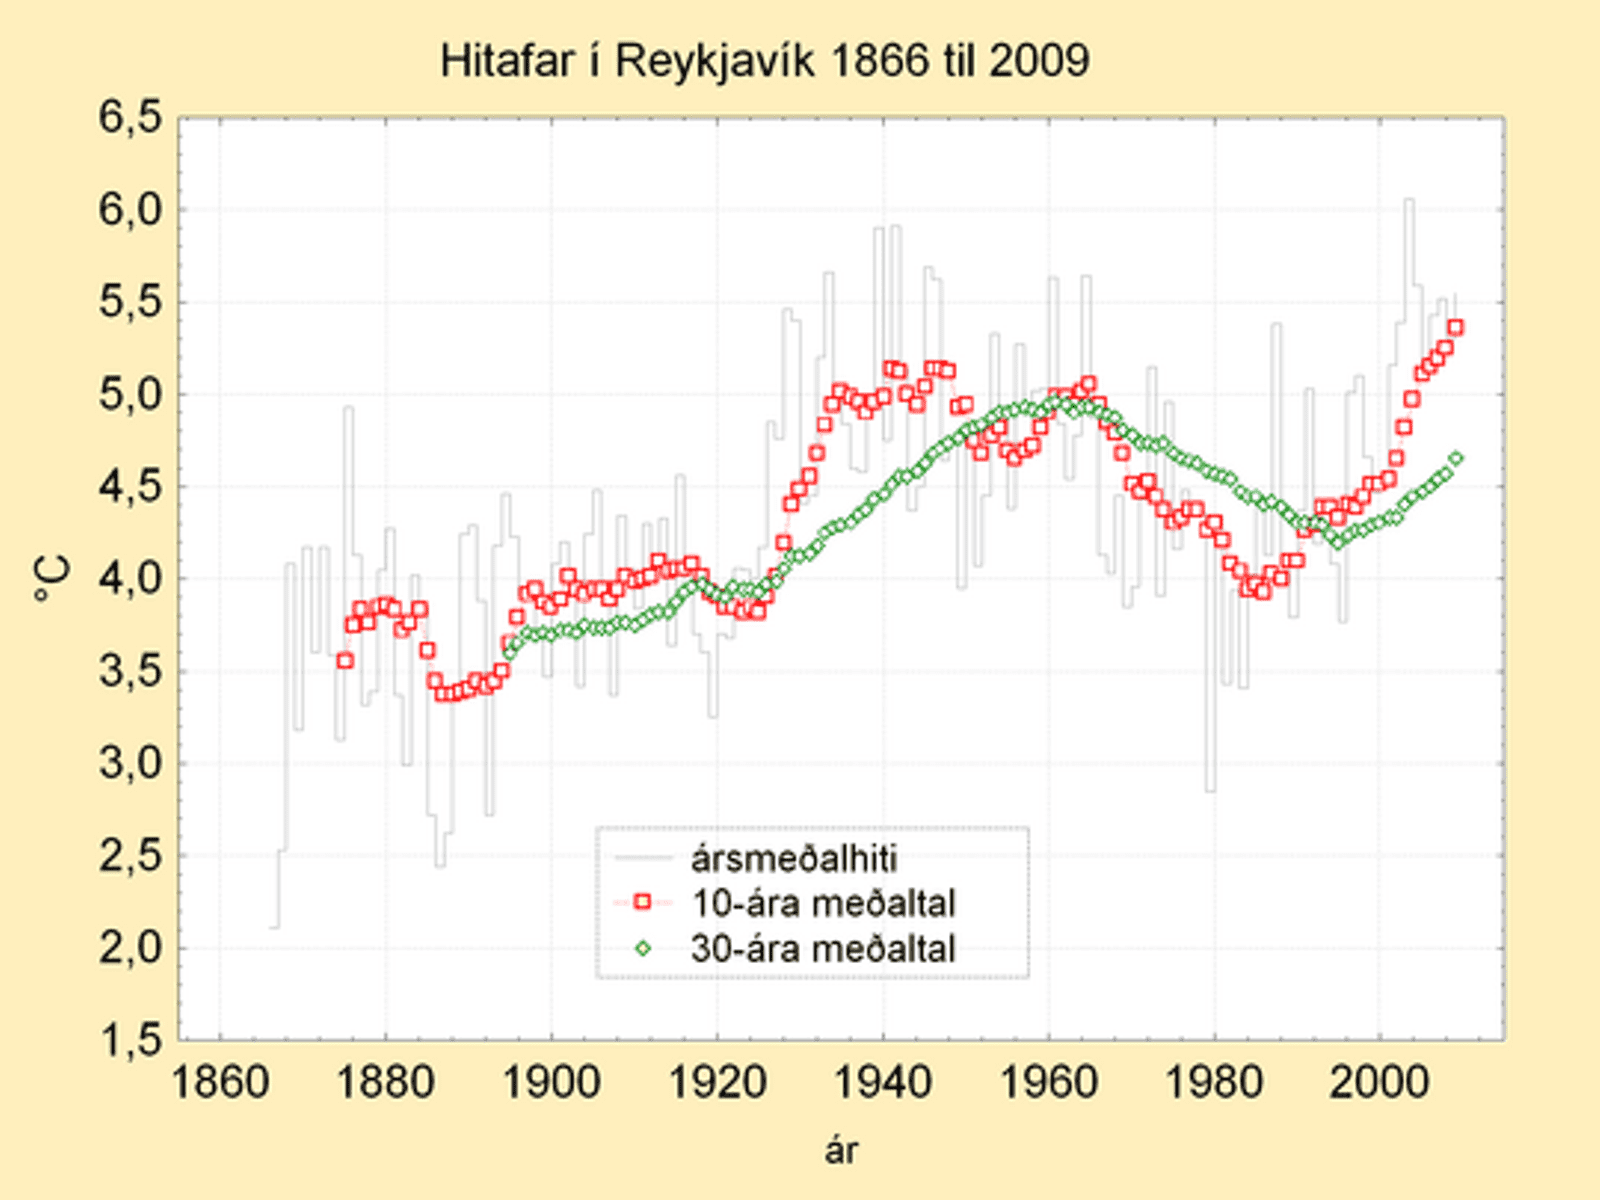
I was perusing temp graph data looking for a back door to get into GHCN (I dont seem to be able to get into the station data anymore, probably my fault) when I spotted a graph for Reykjavik from the Iceland Met.

rvk_hiti6609.png


he wondered why it was so different from the GISS graph

station.gif

http://data.giss.nasa.gov/tmp/gistemp/STATIONS/tmp_620040300000_14_0/station.gif

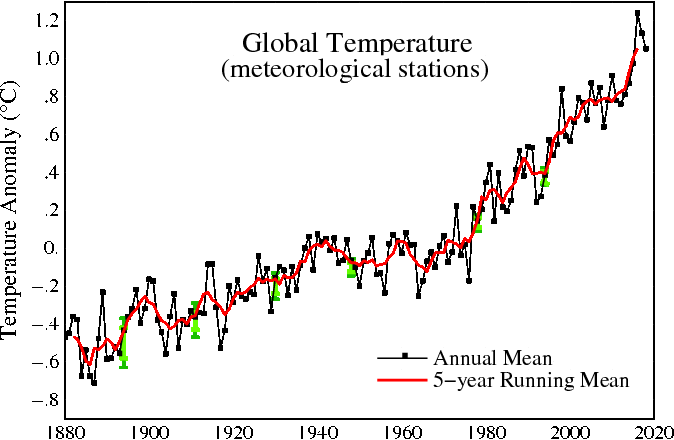
and then he came to the same conclusion that so many of us have. the homogenization schemes simply 'correct' any and all records to match the global graph

Fig.A.gif


single stations are changed to look like their neighbours, neighbours are changed to look like their regions, regions are changed to look like their country, countries are changed to look like their continents, continents are changed to look like the globe. if you run the data through the homogenization enough times it all looks the same.

The models are right and empirical evidence is wrong, so it must be altered to match what is right.... RIGHT?
 

Forum List

Back
Top