Cuyo
Training a Guineapig army
This press release is a great example of Orwellian Spin.
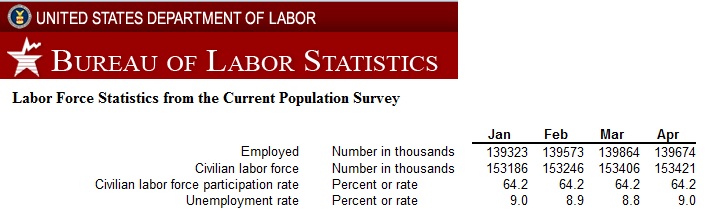
In the details of the actual BLS stats, 190,000 LESS people were employed in the U.S. comparing the end of April to the end of March.
If the economy created 244K new jobs, it lost EVEN MORE.
Employment Situation Summary Table A. Household data, seasonally adjusted
Civilian Noninstitutional Population increased by 146K
Total Employed decreased by 190K
Total Unemployed increased by 205K
Not In The Labor Force increased by 131K
The number of Unemployed is increasing faster than the population in general; and the Labor Force Participation Rate decreased to 58.4%, meaning almost the entire increase in the population resulted translated into Non Participation.
How anyone can think this shows economic improvement is beyond comprehension.
That particular chart is Y/Y numbers, thus irrelevant to rise in unemployment last month.
It appears total employed actually went up last month, but enough discouraged workers became... ahem... 'encouraged' again that the result was a rise in unemployment - At least, I don't see any other explanation.
The only sector to shed jobs was state and local government.