Old Rocks
Diamond Member
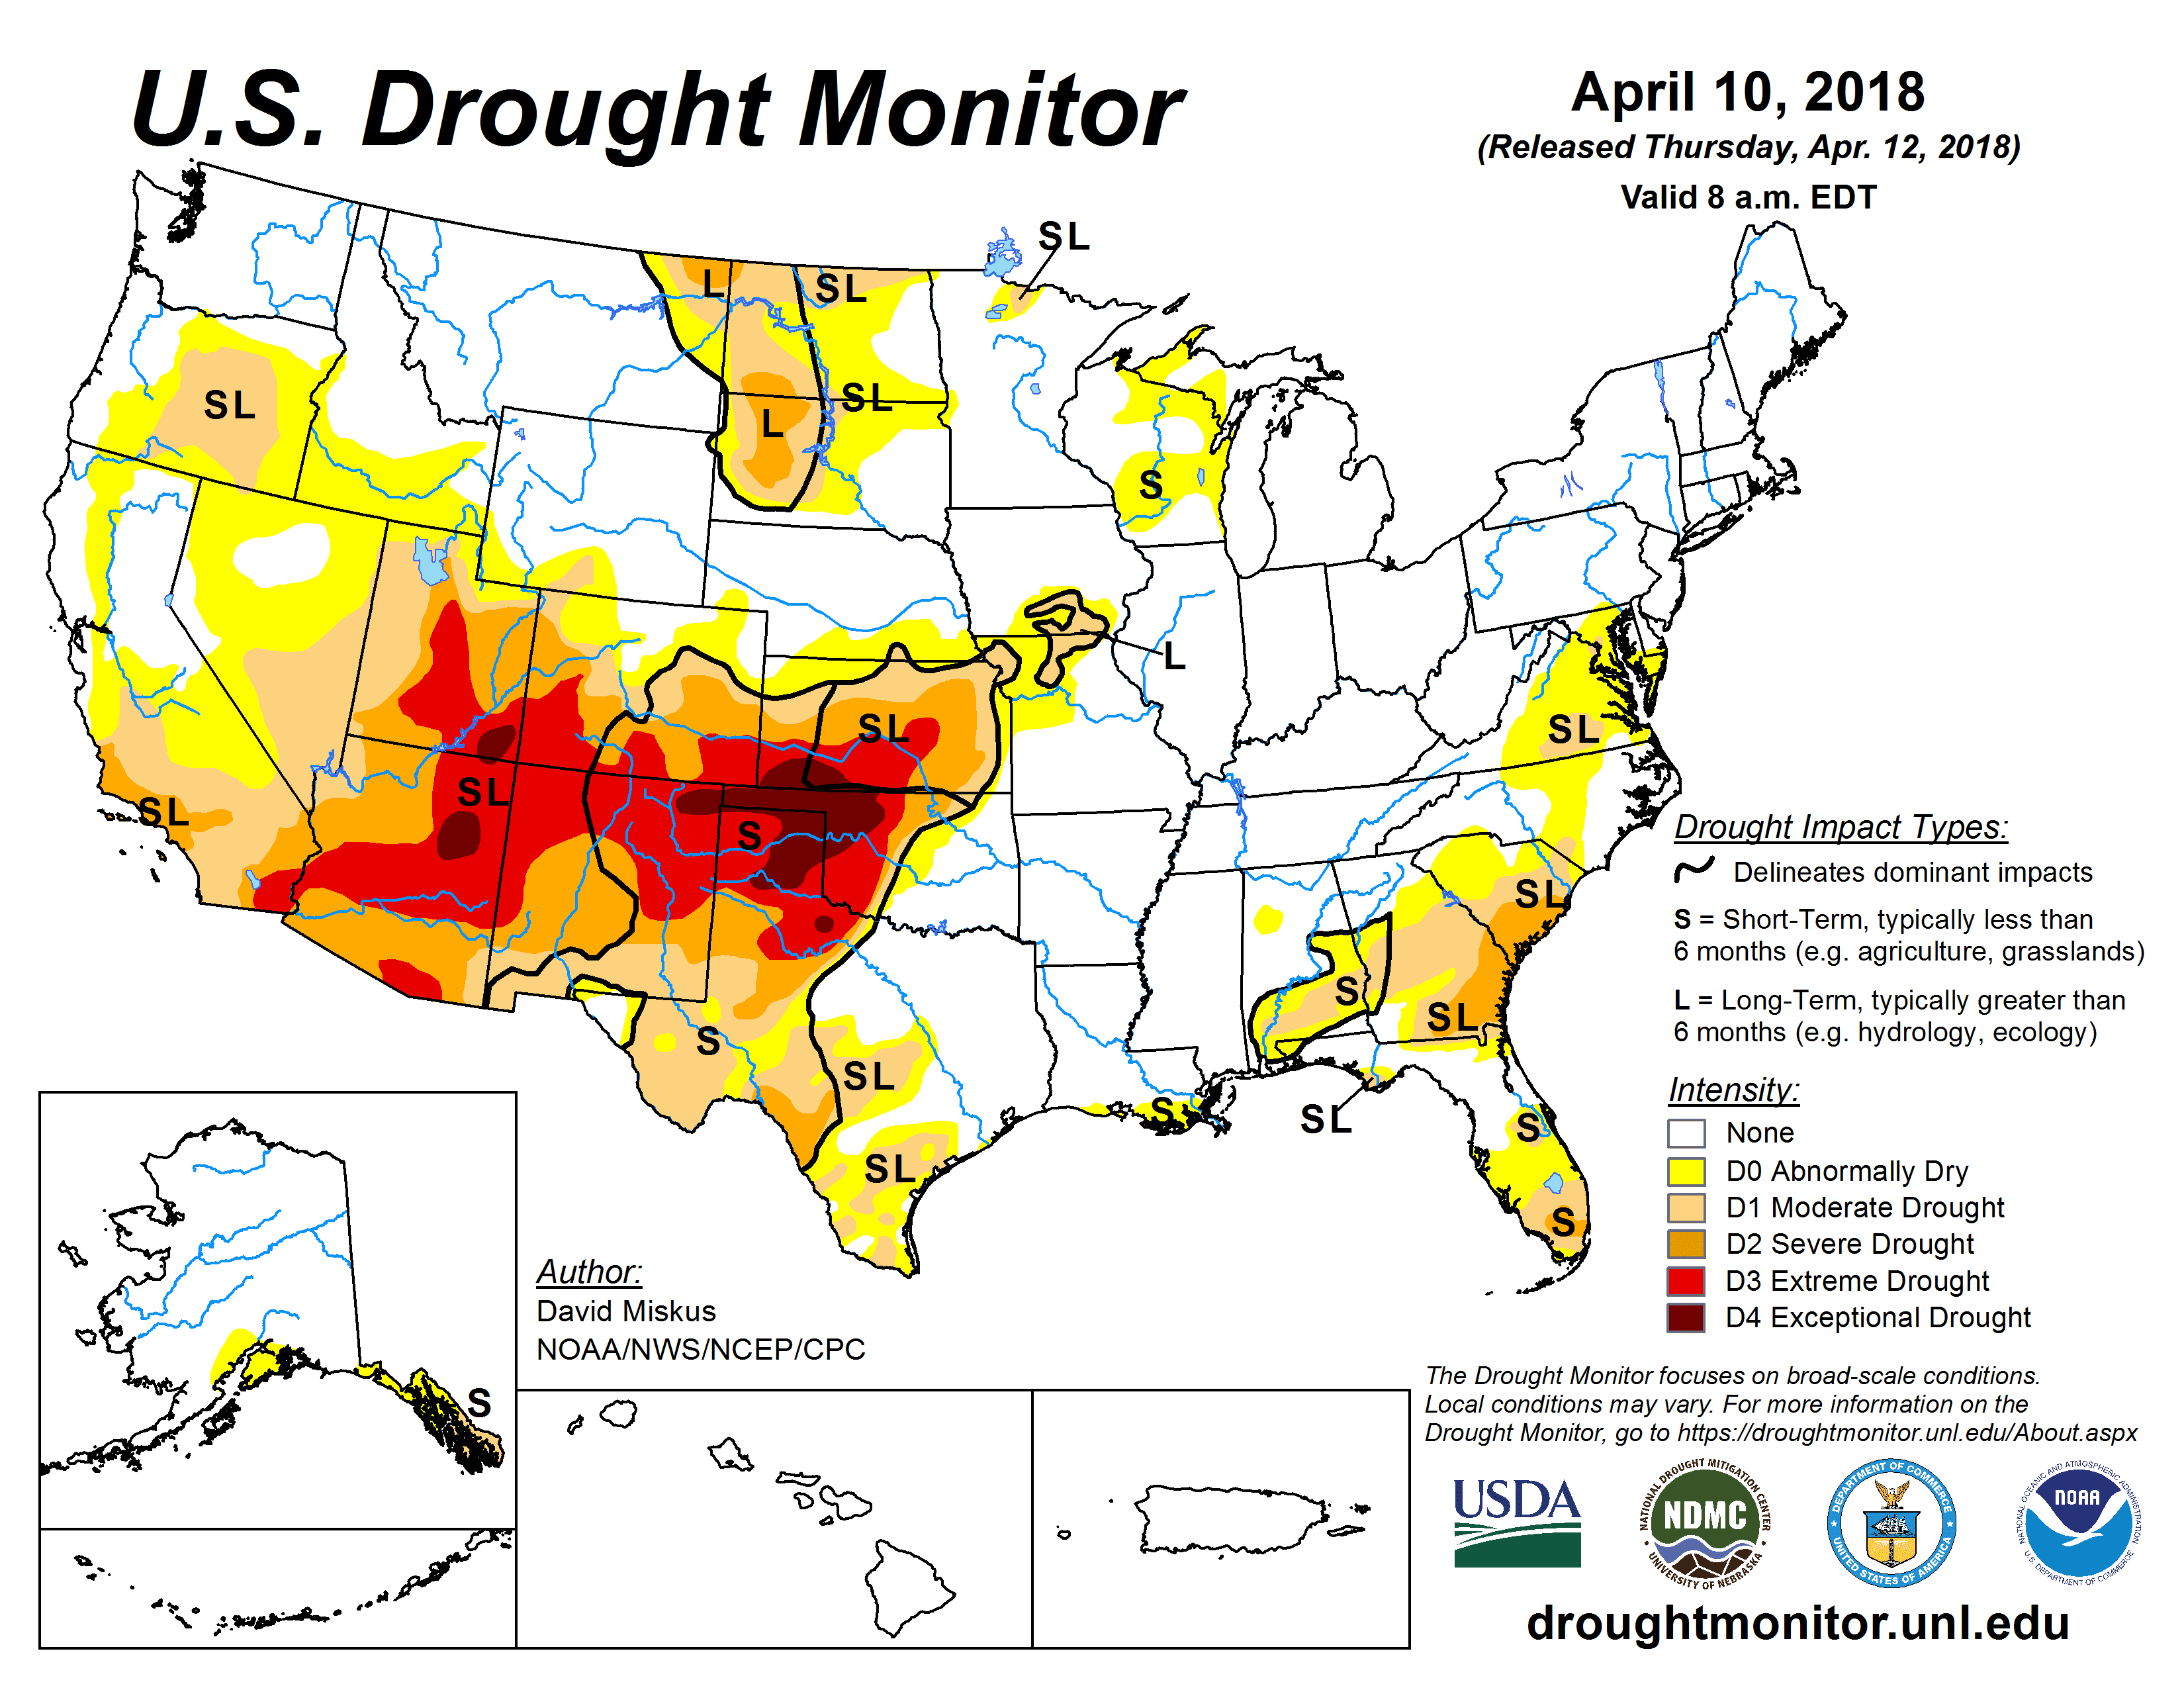
U.S. Drought Monitor
The west has had a series of droughts, and our forests and crops are paying the price.
Follow along with the video below to see how to install our site as a web app on your home screen.

Note: This feature currently requires accessing the site using the built-in Safari browser.
But otherwise the rest US of are experiencing warmer dryer conditions. Here in Colorado, the profits of Vail or Aspen and the entire Colorado ski industry is down because of the lower snow pack per annum, that says it all. Global warming is a fraud? Hell,Colorado or in the western part of the US sees less precipitation, higher average temperatures, and less SNOW. That is a real factor. We have far more fire events overall, less snow or blizzard warnings In Colorado. In the 60 years of my life, this is alarming.
Moron...
U.S. Drought Monitor
The west has had a series of droughts, and our forests and crops are paying the price.
Please post the evidence (conservative side) of the calibration record that the Medieval Warm Period was warmer than current global temperature.
U.S. Drought Monitor
The west has had a series of droughts, and our forests and crops are paying the price.
There isn't any global warming? Global warming is a lie? I digress...The Winter Olympics committee has to whittle down year by year, all the countries that actualy have winters cold enough to allow SNOW? We have less countries that can support winter Olympics every year. That is also a sad fact. We killed winter...
There isn't any global warming? Global warming is a lie? I digress...The Winter Olympics committee has to whittle down year by year, all the countries that actualy have winters cold enough to allow SNOW? We have less countries that can support winter Olympics every year. That is also a sad fact. We killed winter...
Hey sweetie I hate to break it to you but the only thing that matters is the public perception.... doesn't matter what the scientists are saying. When 80% of 320 million people are freezing their nuts sacks off 8 months out of the year, nothing heroic is going to be being done about climate change. And clearly we see that dynamic being played out right now.... the public isn't giving a rat's ass about climate change. And the evidence to support that is staggering.
The goofball climate Crusaders ran on the hoax of the entire world warming.... and they got it wrong. People who go to the polls and vote have figured out that the climate modeling is a load of s***....... when you have to leave your house with ball warmers every morning, the science gets laughed at. This is something members of the religion fail to comprehend.... which is excellent news for the rest of us.

A NEW RECONSTRUCTION OF TEMPERATURE VARIABILITY IN THE EXTRA‐TROPICAL NORTHERN HEMISPHERE DURING THE LAST TWO MILLENNIAPlease post the evidence (conservative side) of the calibration record that the Medieval Warm Period was warmer than current global temperature.
These are SCIENTIFIC papers. They have no political bias. They just present facts. There are loads more but this will get you started.
https://onlinelibrary.wiley.com/doi/pdf/10.1111/j.1468-0459.2010.00399.x
https://agupubs.onlinelibrary.wiley.com/doi/abs/10.1002/2017PA003237
http://journals.sagepub.com/doi/abs/10.1177/0959683615596827
https://agupubs.onlinelibrary.wiley.com/doi/full/10.1002/2016GL071849
http://epic.awi.de/17919/1/Ste2007b.pdf
Warming and Cooling: The Medieval Climate Anomaly in Africa and Arabia
Sebastian Lüning
Mariusz Gałka
Fritz Vahrenholt
Abstract
The Medieval Climate Anomaly (MCA) is a well‐recognized climate perturbation in many parts of the world, with a core period of 1000–1200 Common Era. Here we present a palaeotemperature synthesis for the MCA in Africa and Arabia, based on 44 published localities. The data sets have been thoroughly correlated and the MCA trends palaeoclimatologically mapped. The vast majority of available Afro‐Arabian onshore sites suggest a warm MCA, with the exception of the southern Levant where the MCA appears to have been cold. MCA cooling has also been documented in many segments of the circum‐Africa‐Arabian upwelling systems, as a result of changes in the wind systems which were leading to an intensification of cold water upwelling. Offshore cores from outside upwelling systems mostly show warm MCA conditions. The most likely key drivers of the observed medieval climate change are solar forcing and ocean cycles. Conspicuous cold spikes during the earliest and latest MCA may help to discriminate between solar (Oort Minimum) and ocean cycle (Atlantic Multidecadal Oscillation, AMO) influence. Compared to its large share of nearly one quarter of the world's landmass, data from Africa and Arabia are significantly underrepresented in global temperature reconstructions of the past 2,000 years. Onshore data are still absent for most regions in Africa and Arabia, except for regional data clusters in Morocco, South Africa, the East African Rift, and the Levant coast. In order to reconstruct land palaeotemperatures more robustly over Africa and Arabia, a systematic research program is needed.
https://agupubs.onlinelibrary.wiley.com/doi/abs/10.1002/2017PA003237
So there were warm and cold areas in Africa and the Near East. But no quantification on how cold or how warm, and no comparison to present temperatures. Once again, Mr. Westwall misrepresents what is in a scientific article. One has to wonder if he even bothered to read the abstract.

A NEW RECONSTRUCTION OF TEMPERATURE VARIABILITY IN THE EXTRA‐TROPICAL NORTHERN HEMISPHERE DURING THE LAST TWO MILLENNIAPlease post the evidence (conservative side) of the calibration record that the Medieval Warm Period was warmer than current global temperature.
These are SCIENTIFIC papers. They have no political bias. They just present facts. There are loads more but this will get you started.
https://onlinelibrary.wiley.com/doi/pdf/10.1111/j.1468-0459.2010.00399.x
https://agupubs.onlinelibrary.wiley.com/doi/abs/10.1002/2017PA003237
http://journals.sagepub.com/doi/abs/10.1177/0959683615596827
https://agupubs.onlinelibrary.wiley.com/doi/full/10.1002/2016GL071849
http://epic.awi.de/17919/1/Ste2007b.pdf
FREDRIK CHARPENTIER LJUNGQVIST
ABSTRACT.
A new temperature reconstruction with decadal resolution, covering the last two millennia, is presented for the extratropical Northern Hemisphere (90–30°N), utilizing many palaeo‐temperature proxy records never previously included in any large‐scale temperature reconstruction. The amplitude of the reconstructed temperature variability on centennial time‐scales exceeds 0.6°C. This reconstruction is the first to show a distinct Roman Warm Period c. ad 1–300, reaching up to the 1961–1990 mean temperature level, followed by the Dark Age Cold Period c. ad 300–800. The Medieval Warm Period is seen c. ad 800–1300 and the Little Ice Age is clearly visible c. ad 1300–1900, followed by a rapid temperature increase in the twentieth century. The highest average temperatures in the reconstruction are encountered in the mid to late tenth century and the lowest in the late seventeenth century. Decadal mean temperatures seem to have reached or exceeded the 1961–1990 mean temperature level during substantial parts of the Roman Warm Period and the Medieval Warm Period. The temperature of the last two decades, however, is possibly higher than during any previous time in the past two millennia, although this is only seen in the instrumental temperature data and not in the multi‐proxy reconstruction itself. Our temperature reconstruction agrees well with the reconstructions by Moberg et al. (2005) and Mann et al. (2008) with regard to the amplitude of the variability as well as the timing of warm and cold periods, except for the period c. ad 300–800, despite significant differences in both data coverage and methodology.
https://onlinelibrary.wiley.com/doi/pdf/10.1111/j.1468-0459.2010.00399.x
Mr. Westwall continues to lie about what the links he posts state. This is the first link he posted, and it clearly states that the last two decades look as if they were the warmest in the last two millenia.


I am reminded of the old saying that if you can't dazzle them with brilliance, baffle them with bullshit.Headline - Empty space has remained at -453 degrees Fahrenheit for billions of years, thus disproving global warming.
Said one particular unknowing boob from south of the Mason Dixon line "If space is so cold the Earth can't be that warm can it? Use yer heads people."
It sounds like somebody is in denial. I understand that the Sahara used to be a verdant rain forest, things change. That took thousands of years. Now? it's a matter of decades...i am seeing it, and heartily agree it's human caused. 7 billion people are having effects in more ways than just weather, too. Let's just ignore the facts and whistle past the graveyard.Moron...
U.S. Drought Monitor
The west has had a series of droughts, and our forests and crops are paying the price.
La Niña Pattern. nothin to see here or worry about... Natural Variation..
Gotta love this global warming. Oh, wait.Brad, goes silly in the thread avoiding the posted article completely to push his silly spin.
From Real Climate Science
View attachment 188060
LINK
