And then on the 1964 CRA, pushed to its conclusion by LBJ and HHH, she again glosses over the stark statistical fact that both "Democrats" and "Republians" favored and passed the bill while "Southerners" were against it --- Republicans more against it than Democrats.
You keep blabbering this fractured history in thread after thread -- but the facts are simple to locate and absorb. Yet you won't do it..
Senate final vote on CRA passage..
Democrats Republicans
Yea 46 ---------- 27
Nay 21 ---------- 6
After awhile, folks just stop reading your fractured history analysis of the 2 parties..
And I've corrected this bogus distinction time after time after time after time, which is exactly what I'm referring to.
Natuarally I bookmarked it since it doesn't seem to take. Roll tape on that moldy oldie.
- - - - - - - - - - - - - - - - - - - - - - - - - - - - - - - - - - - - - - - - - - - - - - - - - - - - - - -
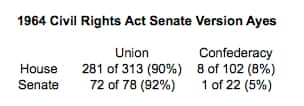
The original House version:
- Southern Democrats: 7–87 (7–93%)
- Southern Republicans: 0–10 (0–100%)
- >>> ALL SOUTHERNERS: 7-97 (6.7%--93.3%)
- Northern Democrats: 145–9 (94 – 6%)
- Northern Republicans: 138–24 (85 – 15%)
- >>> ALL NONSOUTHERNERS: 283-33 (89.6%--11.4%)
The Senate version:
- Southern Democrats: 1–20 (5–95%)
- Southern Republicans: 0–1 (0–100%)
- Northern Democrats: 45–1 (98–2%)
- Northern Republicans: 27–5 (84–16%)
- ALL SOUTHERNERS: 1--21 (4.5%--95.5%)
- ALL NONSOUTHERNERS: 72--6 (92.3%--7.7%)
Yes, there is a party pattern in that each line shows more support from the D side than the R side. But again, 94 versus 85 on one side is not significant.
But
96 on one side versus 92 on the other side?? You just hit the motherlode.
NOW you can cite chew some polarization. BIG time.
The numbers don't lie; your pattern is clearly there but it's regional, not political. And
regional, once again, means
cultural.
You take the numbers from the North -- both Dems and Repubs are for it.
You take the numbers from the South -- both Dems and Repubs are agin' it.
It's truly bipartisan in both directions. (!)
- - - - - - - - - - - - - - - - - - - - - - - - - - - - - - - - - - - - - - - - - - - - - - - - - - - - - - -
You'll notice, as already stated, that for what it's worth Southern Republicans were more in the No column than Southern Democrats were. That's really not significant ---- because they're Southerners. So again it was never about a political party, following as I said the fact that racism is not a political issue but a
sociocultural one. That's why there's no significant difference between Democrats and Republicans but a YUGE significant difference between the former Confederacy and the others. Regardless of party. So to try to cherrypick this into political parties is just dishonest. Nobody's gonna sit here with a straight face and claim a 13-17 point difference means something while an 82-87 point difference does not.
I'm not the only one to have analyzed this honestly ---
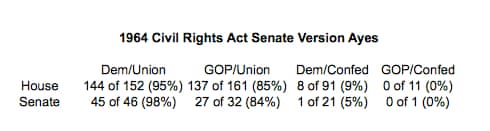
>> What linked Dirksen (R-IL) and Mansfield (D-MT) was the fact that
they weren't from the south. In fact, 90% of members of Congress from states (or territories) that were part of the Union voted in favor of the act, while less than 10% of members of Congress from the old Confederate states voted for it.
This 80pt difference between regions is far greater than the 15pt difference between parties.
But what happens when we control for both party affiliation and region? As Sean Trende
noted earlier this year, "sometimes relationships become apparent only after you control for other factors".
In this case, it becomes clear that Democrats in the north and the south were more likely to vote for the bill than Republicans in the north and south respectively. This difference in
both houses is statistically significant with over 95% confidence. It just so happened southerners made up a larger percentage of the Democratic than Republican caucus, which created the initial impression than Republicans were more in favor of the act.
Nearly 100% of Union state Democrats supported the 1964 Civil Rights Act compared to 85% of Republicans. None of the southern Republicans voted for the bill, while a small percentage of southern
Democrats did.
The same pattern holds true when looking at ideology instead of party affiliation. The folks over
at Voteview.com, who created
DW-nominate scores to measure the ideology of congressmen and senators, found that the more liberal a congressman or senator was the more likely he would vote for the Civil Rights Act of 1964, once one controlled for a factor closely linked to geography. << (----
The Guardian)
Which is, again, exactly as I posted. K?
This charade of trying to pretend the red puppets and the blue puppets are somehow different animals only serves to distract from the real dynamics.