Dad2three
Gold Member
It's not due to Boomer Retirement:
...the U.S. has had over 3 million high school graduates every year during the Obama administration --- those who would be potentially entering the work force for the very first time, even if they go on to also enroll in college.
So on average, theoretically, the U.S. would need to have 3 million retirees and disabled people every year going on the Social Security "dole" to necessarily break even on the labor force participation rate. But that hasn't been happening.
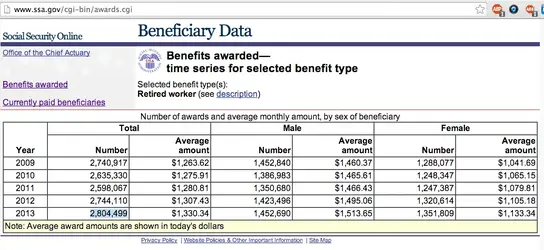
According to data from the Social Security Administration, as of January 2009 when Obama first took office, the U.S. had a total of 39,927,185 retired and disabled workers receiving a monthly Social Security benefit --- 32,484,808 retired and 7,442,377 disabled.
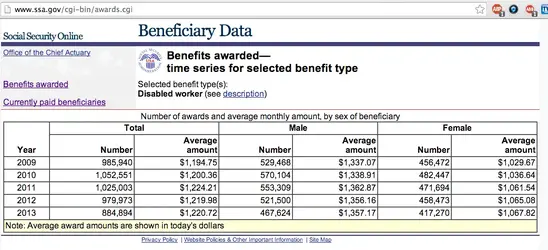
Almost 5 years later, as of November 2013, the U.S. had a total of 46,775,537 retired and disabled workers --- 37,833,877 retired and 8,941,660 disabled --- for a net gain of 6,848,352 retired and disabled workers (5,349,069 that retired and 1,499,283 who were awarded on a disability claim).
* It's also worth noting that, while disability "claims" were up in the aftermath of the Great Recession, a Congressional Budget Office study says claims are always up during recessions. But actual disability "awards" are down. Source: SSA (See the full post with data here)
Social Security disability awards
As for the high school graduating classes of 2008 through 2013, the U.S. has had an estimated 15,403,905 high school graduates --- a difference of 8,555,553 who might otherwise be in the labor force when compared to the additional 6,848,352 retired and disabled workers during that same period of time.
The Bureau of Labor Statistics reports that only 48.8 percent of the 3.2 million youth who graduated from high school (just from last year alone) were "in the labor force". In a 14-page report by Rutgers, they noted a whopping 44% of high school students were unemployed ----- meaning:
Since Obama's first year in office, the U.S. has had more "non-starters" than "quitters" in the labor force.
Last year, in a study by the Kansas City Fed (that the Wall Street Journal had cited) they reported:
"An analysis of labor market data suggests that there are no structural changes that can explain movements in unemployment rates over recent years. Neither industrial nor demographic shifts nor a mismatch of skills with job vacancies is behind the increased rates of unemployment."...
Falsely Blaming Baby Boomers for Smaller Labor Force | Bud Meyers
Baby Boomers' Impact on Participation Rate Big, Expected
Retirements account for nearly half of the fall in the participation rate
Baby Boomers Are a Big Part of Labor Participation Rate Decline - US News