Sea levels have been rising for some 14K years...and the rate of rise has decreased in the past decade or so....
Let's see data supporting that statement
Sure crick...I can always support my statements...and even better, I know what the graphs mean.
You aren't seeing 3.3mm of sea level rise per year...not in the actual ocean anyway. You are seeing 3.22mm of sea level rise in graphs...and models produced by those who are perpetuating the AGW narrative and raking in the money for it but in the ocean...sorry....just not there. Not that I think you warmers will be interested in seeing actual evidence of the level of fraud happening within mainstream climate science, but let me show an example for the benefit of those who aren't taking their kook-aid intravenously. Observe....the blatant altering of past sea level data in an effort to reinforce the imminent climate disaster narrative. Much like the blatant alteration of past temperatures to support the current narrative, but that's another post....
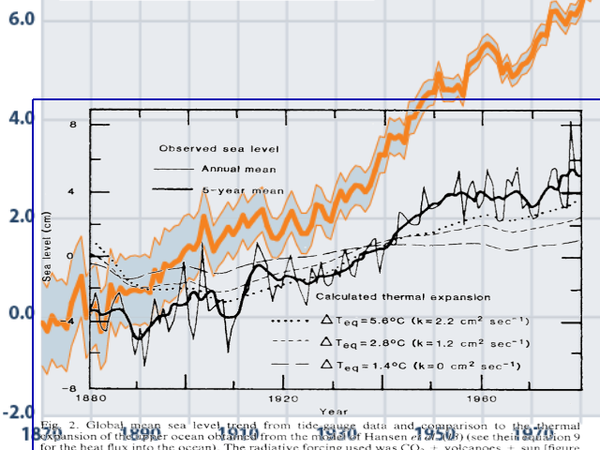
Luckily, old data is still hanging around to be found to bring the fraud of the climate science modern climate science community into high relief. This is the sea level increase between 1880 and 1980 shown by NASA in 1980. The graph shows an increase of just over 3 inches of sea level increase between 1880 and 1980....
NOTE the sharp decrease in the rate of increase after 1950.
You can't really scare people with a 3 inch sea level increase over a 100 year period so the frauds in climate pseudoscience increased the figure to 6 inches per century with nothing more than adjustments.... NOTE the completely FAKE acceleration after 1950.
Here is an overlay of the two graphs on the same time scale. One is scientific in nature...showing actual observed sea level increases...the other is a piece of alarmist propaganda that has nothing whatsoever to do with science and everything to do with supporting a fraudulent narrative.
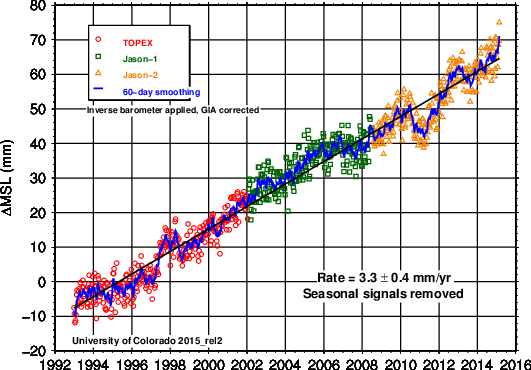
Then in 2004, the University of Colorado showed 2.8 mm per year rate of sea level increase. This is what the RAW Jason and TOPEX data look like...not similar in the least to what you claim to be the RAW data.
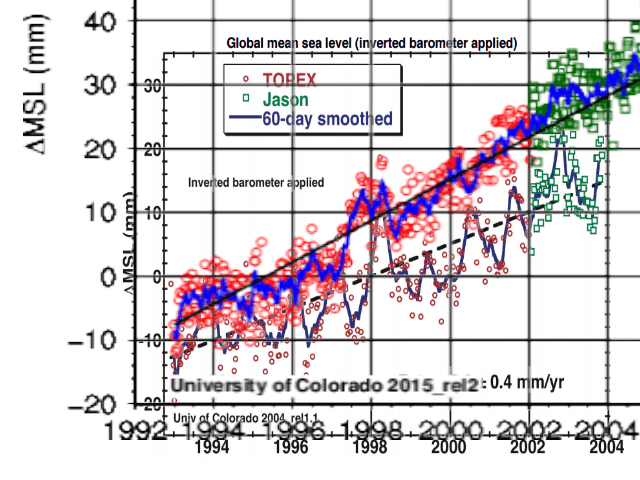
2.8 mm per year? Not very scary...even to alarmists so again, the data is heavily massaged using inappropriate, and completely fraudulent methods to achieve a 3.3mm per year rate of increase. A global isostatic adjustment was applied which is blatantly fraudulent in the context of sea level increase. Such adjustments are correct in the context of calculating ocean depth as the sea floor sinks and have absolutely no relationship to measuring sea level by satellites. Here is what the adjustments look like...recognize the POS graph as the same garbage you posted.
Again....Here is an overlay of the two graphs at the same time scale....one using valid methodology and one using calculations that are not appropriate for determining sea level increase for no other reason than to support the AGW narrative.
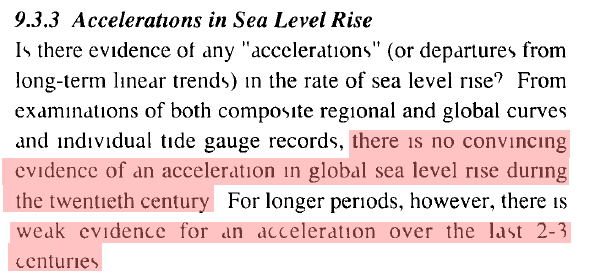
So some numbers got a massage and a picture was painted to give the appearance of imminent disaster. Shit happens...right? But when the "spokes agency" for modern climate science repeats the fraud as truth....we have real evidence of deliberate data corruption with the intent to deceive regarding climate change. In 1990 the IPCC said:
Then in 2013 using blatantly massaged data and obviously fraudulent graphs, the IPCC said exactly the opposite of what they said in 1990. You guys are lairs crick...guilty of malfeasance, and deliberate fraud for no other reason than to gain political power. You have damaged the reputation of science so deeply that it will take many many decades after this circus is over to restore the trust in science that you climate wackos have destroyed for political reasons