US News
the evil right wing cabal
 President Obama Has Outspent Last Five Presidents- Updates
Gave three Pinocchios- it really should have been more
Update, Friday, 5:19 p.m.:
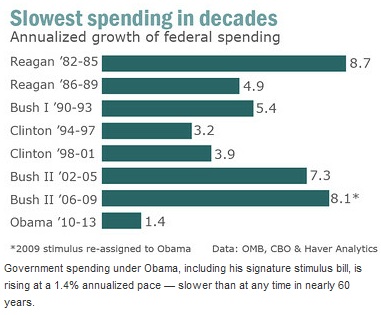
Some readers have pointed out that although Obama passed the stimulus plan, federal spending under his administration has risen at a very slow pace -- the slowest pace, in fact, "since Dwight Eisenhower brought the Korean War to an end in the 1950's," Marketwatch reported last month.
Update, Monday, 9:47 a.m.:
The Washington Post's FactChecker, however,
gave the Marketwatch article "3 pinocchios" for its veracity, writing: "We are talking about the federal budget here. That means lots of numbers -- numbers that are easily manipulated." Factchecker points out some of the methodological issues in Marketwatch's analysis.
Another player in the evil right wing cabal
UPDATE: The Associated Press also dug into the numbers and came to the same conclusion as we did. The problem with that rosy claim is that the Wall Street bailout is part of the calculation. The bailout ballooned the 2009 budget just before Obama took office, making Obamas 2010 results look smaller in comparison. And as almost $150 billion of the bailout was paid back during Obamas watch, the [Nutting] analysis counted them as government spending cuts, the AP said. It also assumes Obama had less of a role setting the budget for 2009 than he really did.
(even the AP is part of the evil right wing cabal)
CBOs analysis of the presidents 2013 budget, which clocks in at $3.72 trillion.
So this is what we end up with:
2008: $2.98 trillion
2009: $3.27 trillion
2010: $3.46 trillion
2011: $3.60 trillion
2012: $3.65 trillion
2013: $3.72 trillion
One common way to measure federal spending is to compare it to the size of the overall U.S. economy. That at least puts the level into context, helping account for population growth, inflation and other factors that affect spending. Heres what the White Houses own budget documents show about spending as a percentage of the U.S. economy (gross domestic product):
2008: 20.8 percent
2009: 25.2 percent
2010: 24.1 percent
2011: 24.1 percent
2012: 24.3 percent
2013: 23.3 percent
In the post-war era, federal spending as a percentage of the U.S. economy has hovered around 20 percent, give or take a couple of percentage points. Under Obama, it has hit highs not seen since the end of World War II completely the opposite of the point asserted by Carney. Part of this, of course, is a consequence of the recession, but it is also the result of a sustained higher level of spending.
---------------------------------------------------------------------
The desperation on the left would be more amusing
if it was not so pathetic