Yes there is. It makes the economy worse and helps get Biden elected. DuhSo now we know that the scientist who made the prediction that there could be "over 2 million dead in US" if there was no lockdown is a quack who is being called one of the "most wrong" scientists in the world, by other scientists. There was never any danger of millions dead, lockdown or no lockdown. See: "‘Professor Lockdown’ Modeler Resigns in Disgrace" (National Review)
Better yet, the new CDC coronavirus mortality rate estimated by CDC puts it firmly in the neighborhood of ordinary flu, which is .1% of cases. The revised estimate follows a study from U Penn Medical Centerwhich puts the real mortality rate even lower, .25%.
Shutdowns and social distancing are imposing the backwards science of preventing herd immunity. By delaying the wall of herd immunity, the RNA virus has more time to mutate into more deadly forms in a deadlier second wave.
For comparison:
Regular flu mortality rate: .1%
1968 Hong Kong flu mortality rate: .5%
1968 season US Hong Kong flu deaths:100,000
1957 H2N2 flu mortality rate .7%
1957 season US H2N2 deaths 116,000
2017 - 2018 US flu deaths: 80,000
Recall that in 1957 and 1968 the US had only 1/2 to 2/3 of the present population.
Reason MagazineThe CDC's New 'Best Estimate' Implies a COVID-19 Infection Fatality Rate Below 0.3%
By JACOB SULLUM|5.24.2020 5:35 PM
That rate is much lower than the numbers used in the horrifying projections that shaped the government response to the epidemic.
According to the Centers for Disease Control and Prevention (CDC), the current "best estimate" for the fatality rate among Americans with COVID-19 symptoms is 0.4 percent. The CDC also estimates that 35 percent of people infected by the COVID-19 virus never develop symptoms. Those numbers imply that the virus kills less than 0.3 percent of people infected by it—far lower than the infection fatality rates (IFRs) assumed by the alarming projections that drove the initial government response to the epidemic, including broad business closure and stay-at-home orders.
The CDC offers the new estimates in its "COVID-19 Pandemic Planning Scenarios," which are meant to guide hospital administrators in "assessing resource needs" and help policy makers "evaluate the potential effects of different community mitigation strategies." It says "the planning scenarios are being used by mathematical modelers throughout the Federal government."
The CDC's five scenarios include one based on "a current best estimate about viral transmission and disease severity in the United States." That scenario assumes a "basic reproduction number" of 2.5, meaning the average carrier can be expected to infect that number of people in a population with no immunity. It assumes an overall symptomatic case fatality rate (CFR) of 0.4 percent, roughly four times the estimated CFR for the seasonal flu. The CDC estimates that the CFR for COVID-19 falls to 0.05 percent among people younger than 50 and rises to 1.3 percent among people 65 and older. For people in the middle (ages 50–64), the estimated CFR is 0.2 percent.
That "best estimate" scenario also assumes that 35 percent of infections are asymptomatic, meaning the total number of infections is more than 50 percent larger than the number of symptomatic cases. It therefore implies that the IFR is between 0.2 percent and 0.3 percent. By contrast, the projections that the CDC made in March, which predicted that as many as 1.7 million Americans could die from COVID-19 without intervention, assumed an IFR of 0.8 percent. Around the same time, researchers at Imperial College produced a worst-case scenario in which 2.2 million Americans died, based on an IFR of 0.9 percent.
Such projections had a profound impact on policy makers in the United States and around the world. At the end of March, President Donald Trump, who has alternated between minimizing and exaggerating the threat posed by COVID-19, warned that the United States could see "up to 2.2 million deaths and maybe even beyond that" without aggressive control measures, including lockdowns.
One glaring problem with those worst-case scenarios was the counterfactual assumption that people would carry on as usual in the face of the pandemic—that they would not take voluntary precautions such as avoiding crowds, minimizing social contact, working from home, wearing masks, and paying extra attention to hygiene. The Imperial College projection was based on "the (unlikely) absence of any control measures or spontaneous changes in individual behaviour." Similarly, the projection of as many as 2.2 million deaths in the United States cited by the White House was based on "no intervention"—not just no lockdowns, but no response of any kind.
Another problem with those projections, assuming that the CDC's current "best estimate" is in the right ballpark, was that the IFRs they assumed were far too high. The difference between an IFR of 0.8 to 0.9 percent and an IFR of 0.2 to 0.3 percent, even in the completely unrealistic worst-case scenarios, is the difference between millions and hundreds of thousands of deaths—still a grim outcome, but not nearly as bad as the horrifying projections cited by politicians to justify the sweeping restrictions they imposed...
Navigation
Install the app
How to install the app on iOS
Follow along with the video below to see how to install our site as a web app on your home screen.
Note: This feature may not be available in some browsers.
More options
Style variation
You are using an out of date browser. It may not display this or other websites correctly.
You should upgrade or use an alternative browser.
You should upgrade or use an alternative browser.
New CDC Mortality Rate Down to .3%, There is No Reason for Any Distancing to Go on a Single Day Longer
- Thread starter munkle
- Start date
dudmuck
Diamond Member
Its ICU capacity nearing overflow.A lot of that is expanded Wuhan testing. Death rates have been declining in spite of cases increasing.Deaths lag cases by 3 to 4 weeks.The purpose of lockdowns it to keep the hospitals from overflowing.So now we know that the scientist who made the prediction that there could be "over 2 million dead in US" if there was no lockdown is a quack who is being called one of the "most wrong" scientists in the world, by other scientists. There was never any danger of millions dead, lockdown or no lockdown. See: "‘Professor Lockdown’ Modeler Resigns in Disgrace" (National Review)
Better yet, the new CDC coronavirus mortality rate estimated by CDC puts it firmly in the neighborhood of ordinary flu, which is .1% of cases. The revised estimate follows a study from U Penn Medical Centerwhich puts the real mortality rate even lower, .25%.
Shutdowns and social distancing are imposing the backwards science of preventing herd immunity. By delaying the wall of herd immunity, the RNA virus has more time to mutate into more deadly forms in a deadlier second wave.
For comparison:
Regular flu mortality rate: .1%
1968 Hong Kong flu mortality rate: .5%
1968 season US Hong Kong flu deaths:100,000
1957 H2N2 flu mortality rate .7%
1957 season US H2N2 deaths 116,000
2017 - 2018 US flu deaths: 80,000
Recall that in 1957 and 1968 the US had only 1/2 to 2/3 of the present population.
Reason MagazineThe CDC's New 'Best Estimate' Implies a COVID-19 Infection Fatality Rate Below 0.3%
By JACOB SULLUM|5.24.2020 5:35 PM
That rate is much lower than the numbers used in the horrifying projections that shaped the government response to the epidemic.
According to the Centers for Disease Control and Prevention (CDC), the current "best estimate" for the fatality rate among Americans with COVID-19 symptoms is 0.4 percent. The CDC also estimates that 35 percent of people infected by the COVID-19 virus never develop symptoms. Those numbers imply that the virus kills less than 0.3 percent of people infected by it—far lower than the infection fatality rates (IFRs) assumed by the alarming projections that drove the initial government response to the epidemic, including broad business closure and stay-at-home orders.
The CDC offers the new estimates in its "COVID-19 Pandemic Planning Scenarios," which are meant to guide hospital administrators in "assessing resource needs" and help policy makers "evaluate the potential effects of different community mitigation strategies." It says "the planning scenarios are being used by mathematical modelers throughout the Federal government."
The CDC's five scenarios include one based on "a current best estimate about viral transmission and disease severity in the United States." That scenario assumes a "basic reproduction number" of 2.5, meaning the average carrier can be expected to infect that number of people in a population with no immunity. It assumes an overall symptomatic case fatality rate (CFR) of 0.4 percent, roughly four times the estimated CFR for the seasonal flu. The CDC estimates that the CFR for COVID-19 falls to 0.05 percent among people younger than 50 and rises to 1.3 percent among people 65 and older. For people in the middle (ages 50–64), the estimated CFR is 0.2 percent.
That "best estimate" scenario also assumes that 35 percent of infections are asymptomatic, meaning the total number of infections is more than 50 percent larger than the number of symptomatic cases. It therefore implies that the IFR is between 0.2 percent and 0.3 percent. By contrast, the projections that the CDC made in March, which predicted that as many as 1.7 million Americans could die from COVID-19 without intervention, assumed an IFR of 0.8 percent. Around the same time, researchers at Imperial College produced a worst-case scenario in which 2.2 million Americans died, based on an IFR of 0.9 percent.
Such projections had a profound impact on policy makers in the United States and around the world. At the end of March, President Donald Trump, who has alternated between minimizing and exaggerating the threat posed by COVID-19, warned that the United States could see "up to 2.2 million deaths and maybe even beyond that" without aggressive control measures, including lockdowns.
One glaring problem with those worst-case scenarios was the counterfactual assumption that people would carry on as usual in the face of the pandemic—that they would not take voluntary precautions such as avoiding crowds, minimizing social contact, working from home, wearing masks, and paying extra attention to hygiene. The Imperial College projection was based on "the (unlikely) absence of any control measures or spontaneous changes in individual behaviour." Similarly, the projection of as many as 2.2 million deaths in the United States cited by the White House was based on "no intervention"—not just no lockdowns, but no response of any kind.
Another problem with those projections, assuming that the CDC's current "best estimate" is in the right ballpark, was that the IFRs they assumed were far too high. The difference between an IFR of 0.8 to 0.9 percent and an IFR of 0.2 to 0.3 percent, even in the completely unrealistic worst-case scenarios, is the difference between millions and hundreds of thousands of deaths—still a grim outcome, but not nearly as bad as the horrifying projections cited by politicians to justify the sweeping restrictions they imposed...
case in point: arizona, which lifted 3 weeks ago, and is about to overflow
see which states are doing better and worse: Rt Covid-19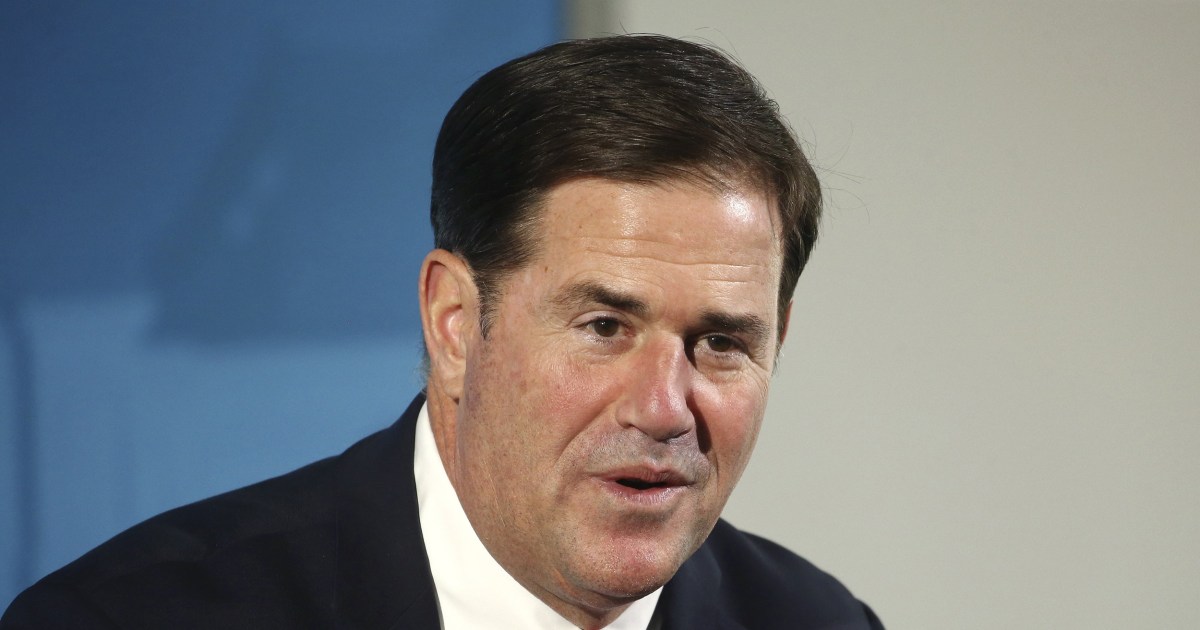
Coronavirus is making a comeback in Arizona
Gov. Doug Ducey insists "this is not a crisis situation," even as the state's COVID-19 death toll has climbed over 1,000.www.nbcnews.com
The article you link says exactly the opposite, that AZ is not overwhelmed. Right now Arizona deaths are about the same as during the 2018 flu season. This is not ebola or anything like it. It's just another flu.
Another thing everyone forgets is the 1957 and 1968 pandemics, when per capita deaths were much higher than COVID.
Per Capita Deaths Were Higher in 1968 and 1957 US Flu Epidemics, and Everything Was Normal, Including Woodstock
View attachment 350371

Is There Really a Crisis? COVID Deaths Compared to 2018 Flu Deaths, State by State
In 2018 in Alabama 1,256 died of the normal flu, compared to 538 of the COVID virus at the time of writing this year, with the worst of flu season over if this coronavirus behaves like every other …coronanews123.wordpress.com
Arizona cases started climbing after may 26th, stable prior to that. Today 3 times the cases per day as there was before may 26th in Arizona.
Now Arizona has the worst spreading rate in the nation: Rt Covid-19
You cannot explain this to some people. Announcing new cases every day is like announcing how many people caught a cold. The mortality rate is what is important.
Having to bring in nurses from out of state.
RoshawnMarkwees
Assimilationist
- Banned
- #23
I’m aware. Data and facts just piss-off lefties.A lot of that is expanded Wuhan testing. Death rates have been declining in spite of cases increasing.Deaths lag cases by 3 to 4 weeks.The purpose of lockdowns it to keep the hospitals from overflowing.So now we know that the scientist who made the prediction that there could be "over 2 million dead in US" if there was no lockdown is a quack who is being called one of the "most wrong" scientists in the world, by other scientists. There was never any danger of millions dead, lockdown or no lockdown. See: "‘Professor Lockdown’ Modeler Resigns in Disgrace" (National Review)
Better yet, the new CDC coronavirus mortality rate estimated by CDC puts it firmly in the neighborhood of ordinary flu, which is .1% of cases. The revised estimate follows a study from U Penn Medical Centerwhich puts the real mortality rate even lower, .25%.
Shutdowns and social distancing are imposing the backwards science of preventing herd immunity. By delaying the wall of herd immunity, the RNA virus has more time to mutate into more deadly forms in a deadlier second wave.
For comparison:
Regular flu mortality rate: .1%
1968 Hong Kong flu mortality rate: .5%
1968 season US Hong Kong flu deaths:100,000
1957 H2N2 flu mortality rate .7%
1957 season US H2N2 deaths 116,000
2017 - 2018 US flu deaths: 80,000
Recall that in 1957 and 1968 the US had only 1/2 to 2/3 of the present population.
Reason MagazineThe CDC's New 'Best Estimate' Implies a COVID-19 Infection Fatality Rate Below 0.3%
By JACOB SULLUM|5.24.2020 5:35 PM
That rate is much lower than the numbers used in the horrifying projections that shaped the government response to the epidemic.
According to the Centers for Disease Control and Prevention (CDC), the current "best estimate" for the fatality rate among Americans with COVID-19 symptoms is 0.4 percent. The CDC also estimates that 35 percent of people infected by the COVID-19 virus never develop symptoms. Those numbers imply that the virus kills less than 0.3 percent of people infected by it—far lower than the infection fatality rates (IFRs) assumed by the alarming projections that drove the initial government response to the epidemic, including broad business closure and stay-at-home orders.
The CDC offers the new estimates in its "COVID-19 Pandemic Planning Scenarios," which are meant to guide hospital administrators in "assessing resource needs" and help policy makers "evaluate the potential effects of different community mitigation strategies." It says "the planning scenarios are being used by mathematical modelers throughout the Federal government."
The CDC's five scenarios include one based on "a current best estimate about viral transmission and disease severity in the United States." That scenario assumes a "basic reproduction number" of 2.5, meaning the average carrier can be expected to infect that number of people in a population with no immunity. It assumes an overall symptomatic case fatality rate (CFR) of 0.4 percent, roughly four times the estimated CFR for the seasonal flu. The CDC estimates that the CFR for COVID-19 falls to 0.05 percent among people younger than 50 and rises to 1.3 percent among people 65 and older. For people in the middle (ages 50–64), the estimated CFR is 0.2 percent.
That "best estimate" scenario also assumes that 35 percent of infections are asymptomatic, meaning the total number of infections is more than 50 percent larger than the number of symptomatic cases. It therefore implies that the IFR is between 0.2 percent and 0.3 percent. By contrast, the projections that the CDC made in March, which predicted that as many as 1.7 million Americans could die from COVID-19 without intervention, assumed an IFR of 0.8 percent. Around the same time, researchers at Imperial College produced a worst-case scenario in which 2.2 million Americans died, based on an IFR of 0.9 percent.
Such projections had a profound impact on policy makers in the United States and around the world. At the end of March, President Donald Trump, who has alternated between minimizing and exaggerating the threat posed by COVID-19, warned that the United States could see "up to 2.2 million deaths and maybe even beyond that" without aggressive control measures, including lockdowns.
One glaring problem with those worst-case scenarios was the counterfactual assumption that people would carry on as usual in the face of the pandemic—that they would not take voluntary precautions such as avoiding crowds, minimizing social contact, working from home, wearing masks, and paying extra attention to hygiene. The Imperial College projection was based on "the (unlikely) absence of any control measures or spontaneous changes in individual behaviour." Similarly, the projection of as many as 2.2 million deaths in the United States cited by the White House was based on "no intervention"—not just no lockdowns, but no response of any kind.
Another problem with those projections, assuming that the CDC's current "best estimate" is in the right ballpark, was that the IFRs they assumed were far too high. The difference between an IFR of 0.8 to 0.9 percent and an IFR of 0.2 to 0.3 percent, even in the completely unrealistic worst-case scenarios, is the difference between millions and hundreds of thousands of deaths—still a grim outcome, but not nearly as bad as the horrifying projections cited by politicians to justify the sweeping restrictions they imposed...
case in point: arizona, which lifted 3 weeks ago, and is about to overflow
see which states are doing better and worse: Rt Covid-19Coronavirus is making a comeback in Arizona
Gov. Doug Ducey insists "this is not a crisis situation," even as the state's COVID-19 death toll has climbed over 1,000.
The article you link says exactly the opposite, that AZ is not overwhelmed. Right now Arizona deaths are about the same as during the 2018 flu season. This is not ebola or anything like it. It's just another flu.
Another thing everyone forgets is the 1957 and 1968 pandemics, when per capita deaths were much higher than COVID.
Per Capita Deaths Were Higher in 1968 and 1957 US Flu Epidemics, and Everything Was Normal, Including Woodstock
View attachment 350371
Is There Really a Crisis? COVID Deaths Compared to 2018 Flu Deaths, State by State
In 2018 in Alabama 1,256 died of the normal flu, compared to 538 of the COVID virus at the time of writing this year, with the worst of flu season over if this coronavirus behaves like every other …
Arizona cases started climbing after may 26th, stable prior to that. Today 3 times the cases per day as there was before may 26th in Arizona.
Now Arizona has the worst spreading rate in the nation: Rt Covid-19
You cannot explain this to some people. Announcing new cases every day is like announcing how many people caught a cold. The mortality rate is what is important.
RoshawnMarkwees
Assimilationist
- Banned
- #24
“She believes many of the 46 patients waiting on test results will prove to be negative but still they are occupying an ICU bed.”Its ICU capacity nearing overflow.A lot of that is expanded Wuhan testing. Death rates have been declining in spite of cases increasing.Deaths lag cases by 3 to 4 weeks.The purpose of lockdowns it to keep the hospitals from overflowing.So now we know that the scientist who made the prediction that there could be "over 2 million dead in US" if there was no lockdown is a quack who is being called one of the "most wrong" scientists in the world, by other scientists. There was never any danger of millions dead, lockdown or no lockdown. See: "‘Professor Lockdown’ Modeler Resigns in Disgrace" (National Review)
Better yet, the new CDC coronavirus mortality rate estimated by CDC puts it firmly in the neighborhood of ordinary flu, which is .1% of cases. The revised estimate follows a study from U Penn Medical Centerwhich puts the real mortality rate even lower, .25%.
Shutdowns and social distancing are imposing the backwards science of preventing herd immunity. By delaying the wall of herd immunity, the RNA virus has more time to mutate into more deadly forms in a deadlier second wave.
For comparison:
Regular flu mortality rate: .1%
1968 Hong Kong flu mortality rate: .5%
1968 season US Hong Kong flu deaths:100,000
1957 H2N2 flu mortality rate .7%
1957 season US H2N2 deaths 116,000
2017 - 2018 US flu deaths: 80,000
Recall that in 1957 and 1968 the US had only 1/2 to 2/3 of the present population.
Reason MagazineThe CDC's New 'Best Estimate' Implies a COVID-19 Infection Fatality Rate Below 0.3%
By JACOB SULLUM|5.24.2020 5:35 PM
That rate is much lower than the numbers used in the horrifying projections that shaped the government response to the epidemic.
According to the Centers for Disease Control and Prevention (CDC), the current "best estimate" for the fatality rate among Americans with COVID-19 symptoms is 0.4 percent. The CDC also estimates that 35 percent of people infected by the COVID-19 virus never develop symptoms. Those numbers imply that the virus kills less than 0.3 percent of people infected by it—far lower than the infection fatality rates (IFRs) assumed by the alarming projections that drove the initial government response to the epidemic, including broad business closure and stay-at-home orders.
The CDC offers the new estimates in its "COVID-19 Pandemic Planning Scenarios," which are meant to guide hospital administrators in "assessing resource needs" and help policy makers "evaluate the potential effects of different community mitigation strategies." It says "the planning scenarios are being used by mathematical modelers throughout the Federal government."
The CDC's five scenarios include one based on "a current best estimate about viral transmission and disease severity in the United States." That scenario assumes a "basic reproduction number" of 2.5, meaning the average carrier can be expected to infect that number of people in a population with no immunity. It assumes an overall symptomatic case fatality rate (CFR) of 0.4 percent, roughly four times the estimated CFR for the seasonal flu. The CDC estimates that the CFR for COVID-19 falls to 0.05 percent among people younger than 50 and rises to 1.3 percent among people 65 and older. For people in the middle (ages 50–64), the estimated CFR is 0.2 percent.
That "best estimate" scenario also assumes that 35 percent of infections are asymptomatic, meaning the total number of infections is more than 50 percent larger than the number of symptomatic cases. It therefore implies that the IFR is between 0.2 percent and 0.3 percent. By contrast, the projections that the CDC made in March, which predicted that as many as 1.7 million Americans could die from COVID-19 without intervention, assumed an IFR of 0.8 percent. Around the same time, researchers at Imperial College produced a worst-case scenario in which 2.2 million Americans died, based on an IFR of 0.9 percent.
Such projections had a profound impact on policy makers in the United States and around the world. At the end of March, President Donald Trump, who has alternated between minimizing and exaggerating the threat posed by COVID-19, warned that the United States could see "up to 2.2 million deaths and maybe even beyond that" without aggressive control measures, including lockdowns.
One glaring problem with those worst-case scenarios was the counterfactual assumption that people would carry on as usual in the face of the pandemic—that they would not take voluntary precautions such as avoiding crowds, minimizing social contact, working from home, wearing masks, and paying extra attention to hygiene. The Imperial College projection was based on "the (unlikely) absence of any control measures or spontaneous changes in individual behaviour." Similarly, the projection of as many as 2.2 million deaths in the United States cited by the White House was based on "no intervention"—not just no lockdowns, but no response of any kind.
Another problem with those projections, assuming that the CDC's current "best estimate" is in the right ballpark, was that the IFRs they assumed were far too high. The difference between an IFR of 0.8 to 0.9 percent and an IFR of 0.2 to 0.3 percent, even in the completely unrealistic worst-case scenarios, is the difference between millions and hundreds of thousands of deaths—still a grim outcome, but not nearly as bad as the horrifying projections cited by politicians to justify the sweeping restrictions they imposed...
case in point: arizona, which lifted 3 weeks ago, and is about to overflow
see which states are doing better and worse: Rt Covid-19Coronavirus is making a comeback in Arizona
Gov. Doug Ducey insists "this is not a crisis situation," even as the state's COVID-19 death toll has climbed over 1,000.
The article you link says exactly the opposite, that AZ is not overwhelmed. Right now Arizona deaths are about the same as during the 2018 flu season. This is not ebola or anything like it. It's just another flu.
Another thing everyone forgets is the 1957 and 1968 pandemics, when per capita deaths were much higher than COVID.
Per Capita Deaths Were Higher in 1968 and 1957 US Flu Epidemics, and Everything Was Normal, Including Woodstock
View attachment 350371
Is There Really a Crisis? COVID Deaths Compared to 2018 Flu Deaths, State by State
In 2018 in Alabama 1,256 died of the normal flu, compared to 538 of the COVID virus at the time of writing this year, with the worst of flu season over if this coronavirus behaves like every other …
Arizona cases started climbing after may 26th, stable prior to that. Today 3 times the cases per day as there was before may 26th in Arizona.
Now Arizona has the worst spreading rate in the nation: Rt Covid-19
You cannot explain this to some people. Announcing new cases every day is like announcing how many people caught a cold. The mortality rate is what is important.
Having to bring in nurses from out of state.
munkle
Diamond Member
- Dec 18, 2012
- 6,036
- 10,526
- 2,130
- Thread starter
- Banned
- #25
Its ICU capacity nearing overflow.A lot of that is expanded Wuhan testing. Death rates have been declining in spite of cases increasing.Deaths lag cases by 3 to 4 weeks.The purpose of lockdowns it to keep the hospitals from overflowing.So now we know that the scientist who made the prediction that there could be "over 2 million dead in US" if there was no lockdown is a quack who is being called one of the "most wrong" scientists in the world, by other scientists. There was never any danger of millions dead, lockdown or no lockdown. See: "‘Professor Lockdown’ Modeler Resigns in Disgrace" (National Review)
Better yet, the new CDC coronavirus mortality rate estimated by CDC puts it firmly in the neighborhood of ordinary flu, which is .1% of cases. The revised estimate follows a study from U Penn Medical Centerwhich puts the real mortality rate even lower, .25%.
Shutdowns and social distancing are imposing the backwards science of preventing herd immunity. By delaying the wall of herd immunity, the RNA virus has more time to mutate into more deadly forms in a deadlier second wave.
For comparison:
Regular flu mortality rate: .1%
1968 Hong Kong flu mortality rate: .5%
1968 season US Hong Kong flu deaths:100,000
1957 H2N2 flu mortality rate .7%
1957 season US H2N2 deaths 116,000
2017 - 2018 US flu deaths: 80,000
Recall that in 1957 and 1968 the US had only 1/2 to 2/3 of the present population.
Reason MagazineThe CDC's New 'Best Estimate' Implies a COVID-19 Infection Fatality Rate Below 0.3%
By JACOB SULLUM|5.24.2020 5:35 PM
That rate is much lower than the numbers used in the horrifying projections that shaped the government response to the epidemic.
According to the Centers for Disease Control and Prevention (CDC), the current "best estimate" for the fatality rate among Americans with COVID-19 symptoms is 0.4 percent. The CDC also estimates that 35 percent of people infected by the COVID-19 virus never develop symptoms. Those numbers imply that the virus kills less than 0.3 percent of people infected by it—far lower than the infection fatality rates (IFRs) assumed by the alarming projections that drove the initial government response to the epidemic, including broad business closure and stay-at-home orders.
The CDC offers the new estimates in its "COVID-19 Pandemic Planning Scenarios," which are meant to guide hospital administrators in "assessing resource needs" and help policy makers "evaluate the potential effects of different community mitigation strategies." It says "the planning scenarios are being used by mathematical modelers throughout the Federal government."
The CDC's five scenarios include one based on "a current best estimate about viral transmission and disease severity in the United States." That scenario assumes a "basic reproduction number" of 2.5, meaning the average carrier can be expected to infect that number of people in a population with no immunity. It assumes an overall symptomatic case fatality rate (CFR) of 0.4 percent, roughly four times the estimated CFR for the seasonal flu. The CDC estimates that the CFR for COVID-19 falls to 0.05 percent among people younger than 50 and rises to 1.3 percent among people 65 and older. For people in the middle (ages 50–64), the estimated CFR is 0.2 percent.
That "best estimate" scenario also assumes that 35 percent of infections are asymptomatic, meaning the total number of infections is more than 50 percent larger than the number of symptomatic cases. It therefore implies that the IFR is between 0.2 percent and 0.3 percent. By contrast, the projections that the CDC made in March, which predicted that as many as 1.7 million Americans could die from COVID-19 without intervention, assumed an IFR of 0.8 percent. Around the same time, researchers at Imperial College produced a worst-case scenario in which 2.2 million Americans died, based on an IFR of 0.9 percent.
Such projections had a profound impact on policy makers in the United States and around the world. At the end of March, President Donald Trump, who has alternated between minimizing and exaggerating the threat posed by COVID-19, warned that the United States could see "up to 2.2 million deaths and maybe even beyond that" without aggressive control measures, including lockdowns.
One glaring problem with those worst-case scenarios was the counterfactual assumption that people would carry on as usual in the face of the pandemic—that they would not take voluntary precautions such as avoiding crowds, minimizing social contact, working from home, wearing masks, and paying extra attention to hygiene. The Imperial College projection was based on "the (unlikely) absence of any control measures or spontaneous changes in individual behaviour." Similarly, the projection of as many as 2.2 million deaths in the United States cited by the White House was based on "no intervention"—not just no lockdowns, but no response of any kind.
Another problem with those projections, assuming that the CDC's current "best estimate" is in the right ballpark, was that the IFRs they assumed were far too high. The difference between an IFR of 0.8 to 0.9 percent and an IFR of 0.2 to 0.3 percent, even in the completely unrealistic worst-case scenarios, is the difference between millions and hundreds of thousands of deaths—still a grim outcome, but not nearly as bad as the horrifying projections cited by politicians to justify the sweeping restrictions they imposed...
case in point: arizona, which lifted 3 weeks ago, and is about to overflow
see which states are doing better and worse: Rt Covid-19Coronavirus is making a comeback in Arizona
Gov. Doug Ducey insists "this is not a crisis situation," even as the state's COVID-19 death toll has climbed over 1,000.
The article you link says exactly the opposite, that AZ is not overwhelmed. Right now Arizona deaths are about the same as during the 2018 flu season. This is not ebola or anything like it. It's just another flu.
Another thing everyone forgets is the 1957 and 1968 pandemics, when per capita deaths were much higher than COVID.
Per Capita Deaths Were Higher in 1968 and 1957 US Flu Epidemics, and Everything Was Normal, Including Woodstock
View attachment 350371
Is There Really a Crisis? COVID Deaths Compared to 2018 Flu Deaths, State by State
In 2018 in Alabama 1,256 died of the normal flu, compared to 538 of the COVID virus at the time of writing this year, with the worst of flu season over if this coronavirus behaves like every other …
Arizona cases started climbing after may 26th, stable prior to that. Today 3 times the cases per day as there was before may 26th in Arizona.
Now Arizona has the worst spreading rate in the nation: Rt Covid-19
You cannot explain this to some people. Announcing new cases every day is like announcing how many people caught a cold. The mortality rate is what is important.
Having to bring in nurses from out of state.
Arizona is the 12th oldest state in the US. So not surprised. AZ had 1200 flu deaths in 2017-18 season. Right now these are all getting counted as COVID.
Last edited:
munkle
Diamond Member
- Dec 18, 2012
- 6,036
- 10,526
- 2,130
- Thread starter
- Banned
- #27
Everything with a possible link to COVID is being marked COVID.
Sixth Name On NYT’s List Of ‘Coronavirus Victims’ is 27-Yr-Old Man Who Was Murdered
My question about this NY Times front page tribute to COVID victims is why didn't they put the faces of the 85,000 flu victims that died in 2018? May not 100,000 but that is still a lot of people. It is so obvious they are playing this up heading toward mandatory vaccine. The last shot you will ever have. And people will line right up for it.
RoshawnMarkwees
Assimilationist
- Banned
- #28
Pure propaganda.Everything with a possible link to COVID is being marked COVID.
Sixth Name On NYT’s List Of ‘Coronavirus Victims’ is 27-Yr-Old Man Who Was Murdered
My question about this NY Times front page tribute to COVID victims is why didn't they put the faces of the 85,000 flu victims that died in 2018? May not 100,000 but that is still a lot of people. It is so obvious they are playing this up heading toward mandatory vaccine. The last shot you will ever have. And people will line right up for it.
View attachment 351984
munkle
Diamond Member
- Dec 18, 2012
- 6,036
- 10,526
- 2,130
- Thread starter
- Banned
- #29
Pure propaganda.Everything with a possible link to COVID is being marked COVID.
Sixth Name On NYT’s List Of ‘Coronavirus Victims’ is 27-Yr-Old Man Who Was Murdered
My question about this NY Times front page tribute to COVID victims is why didn't they put the faces of the 85,000 flu victims that died in 2018? May not 100,000 but that is still a lot of people. It is so obvious they are playing this up heading toward mandatory vaccine. The last shot you will ever have. And people will line right up for it.
View attachment 351984
The important question is, to what end?
RoshawnMarkwees
Assimilationist
- Banned
- #30
Marxist control.Pure propaganda.Everything with a possible link to COVID is being marked COVID.
Sixth Name On NYT’s List Of ‘Coronavirus Victims’ is 27-Yr-Old Man Who Was Murdered
My question about this NY Times front page tribute to COVID victims is why didn't they put the faces of the 85,000 flu victims that died in 2018? May not 100,000 but that is still a lot of people. It is so obvious they are playing this up heading toward mandatory vaccine. The last shot you will ever have. And people will line right up for it.
View attachment 351984
The important question is, to what end?
WEATHER53
Diamond Member
- Apr 13, 2017
- 39,324
- 27,957
- 2,915
They are getting panicky to lock us down again with fake headlines about “surging” while completely omitting that number of tests has increased proportionately.
Also for the umpteenth time they are falsely stating again that hospital are overcrowded.
The True and Real Fact Stat is that serious to critical hospital admissions are now way down to their lowest point of 1.33% and you will Never hear that from MSM
Also for the umpteenth time they are falsely stating again that hospital are overcrowded.
The True and Real Fact Stat is that serious to critical hospital admissions are now way down to their lowest point of 1.33% and you will Never hear that from MSM
Last edited:
munkle
Diamond Member
- Dec 18, 2012
- 6,036
- 10,526
- 2,130
- Thread starter
- Banned
- #32
They are getting panicky to lock us down again with fake headlines about “surging” while completely omitting that number of tests has increased proportionately.
Also for the umpteenth time they are falsely stating again that hospital are overcrowded.
The True and Real Fact Stat is that serious to critical hospital admissions are now way down to their lowest point of 1.33% and you will Never hear that from MSM
wow, linky?
esalla
Platinum Member
- Banned
- #33
They are pushing a population control vaccineSo now we know that the scientist who made the prediction that there could be "over 2 million dead in US" if there was no lockdown is a quack who is being called one of the "most wrong" scientists in the world, by other scientists. There was never any danger of millions dead, lockdown or no lockdown. See: "‘Professor Lockdown’ Modeler Resigns in Disgrace" (National Review)
Better yet, the new CDC coronavirus mortality rate estimated by CDC puts it firmly in the neighborhood of ordinary flu, which is .1% of cases. The revised estimate follows a study from U Penn Medical Centerwhich puts the real mortality rate even lower, .25%.
Shutdowns and social distancing are imposing the backwards science of preventing herd immunity. By delaying the wall of herd immunity, the RNA virus has more time to mutate into more deadly forms in a deadlier second wave.
For comparison:
Regular flu mortality rate: .1%
1968 Hong Kong flu mortality rate: .5%
1968 season US Hong Kong flu deaths:100,000
1957 H2N2 flu mortality rate .7%
1957 season US H2N2 deaths 116,000
2017 - 2018 US flu deaths: 80,000
Recall that in 1957 and 1968 the US had only 1/2 to 2/3 of the present population.
munkle
Diamond Member
- Dec 18, 2012
- 6,036
- 10,526
- 2,130
- Thread starter
- Banned
- #34
They are pushing a population control vaccineSo now we know that the scientist who made the prediction that there could be "over 2 million dead in US" if there was no lockdown is a quack who is being called one of the "most wrong" scientists in the world, by other scientists. There was never any danger of millions dead, lockdown or no lockdown. See: "‘Professor Lockdown’ Modeler Resigns in Disgrace" (National Review)
Better yet, the new CDC coronavirus mortality rate estimated by CDC puts it firmly in the neighborhood of ordinary flu, which is .1% of cases. The revised estimate follows a study from U Penn Medical Centerwhich puts the real mortality rate even lower, .25%.
Shutdowns and social distancing are imposing the backwards science of preventing herd immunity. By delaying the wall of herd immunity, the RNA virus has more time to mutate into more deadly forms in a deadlier second wave.
For comparison:
Regular flu mortality rate: .1%
1968 Hong Kong flu mortality rate: .5%
1968 season US Hong Kong flu deaths:100,000
1957 H2N2 flu mortality rate .7%
1957 season US H2N2 deaths 116,000
2017 - 2018 US flu deaths: 80,000
Recall that in 1957 and 1968 the US had only 1/2 to 2/3 of the present population.
Coronavirus vaccines are inherently dangerous. They are know for causing hyper-immune responses when subjects who have developed antibodies for the weakened virus get this by the wild virus. One-third of the people who take the "warp-speed" vaccine this year will be dead in two years. That is why they are rushing it. While the fear is fresh and people will line up.
esalla
Platinum Member
- Banned
- #36
60 people died after catching the h1n1 disease and after having the vaccine in one hospital aloneThey are pushing a population control vaccineSo now we know that the scientist who made the prediction that there could be "over 2 million dead in US" if there was no lockdown is a quack who is being called one of the "most wrong" scientists in the world, by other scientists. There was never any danger of millions dead, lockdown or no lockdown. See: "‘Professor Lockdown’ Modeler Resigns in Disgrace" (National Review)
Better yet, the new CDC coronavirus mortality rate estimated by CDC puts it firmly in the neighborhood of ordinary flu, which is .1% of cases. The revised estimate follows a study from U Penn Medical Centerwhich puts the real mortality rate even lower, .25%.
Shutdowns and social distancing are imposing the backwards science of preventing herd immunity. By delaying the wall of herd immunity, the RNA virus has more time to mutate into more deadly forms in a deadlier second wave.
For comparison:
Regular flu mortality rate: .1%
1968 Hong Kong flu mortality rate: .5%
1968 season US Hong Kong flu deaths:100,000
1957 H2N2 flu mortality rate .7%
1957 season US H2N2 deaths 116,000
2017 - 2018 US flu deaths: 80,000
Recall that in 1957 and 1968 the US had only 1/2 to 2/3 of the present population.
Coronavirus vaccines are inherently dangerous. They are know for causing hyper-immune responses when subjects who have developed antibodies for the weakened virus get this by the wild virus. One-third of the people who take the "warp-speed" vaccine this year will be dead in two years. That is why they are rushing it. While the fear is fresh and people will line up.
Eric Arthur Blair
Diamond Member
- Jul 21, 2015
- 25,955
- 15,967
- 1,415
Someone should do an in depth report on how many deaths are being attributed to Covid despite no link at all.
This is the sort of thing the left used to do. Now they are too busy ginning
up the Covid machine to give a crap!
This is the sort of thing the left used to do. Now they are too busy ginning
up the Covid machine to give a crap!
munkle
Diamond Member
- Dec 18, 2012
- 6,036
- 10,526
- 2,130
- Thread starter
- Banned
- #38
Someone should do an in depth report on how many deaths are being attributed to Covid despite no link at all.
This is the sort of thing the left used to do. Now they are too busy ginning
up the Covid machine to give a crap!
Sixth Name On NYT’s List Of ‘Coronavirus Victims’ is 27-Yr-Old Man Who Was Murdered
Aletheia4u
Gold Member
- Feb 3, 2017
- 7,745
- 1,389
- 195
They are just playing a game of Simon Says to see how much control that they has over you all. And by the way things looks. They has plenty of control over us.
Similar threads
- Replies
- 32
- Views
- 262
- Replies
- 9
- Views
- 408
- Replies
- 53
- Views
- 3K
- Replies
- 1
- Views
- 558
New Topics
-

-

-
 brainstorm question for light experiment
- Started by trevorjohnson83
- Replies: 0
-
-