gw is a LIE!

I can totally understand how someone could have been very concerned in 2000 about AGW. if that is when you made up your mind about where the preponderance of evidence lay then I can see how you stopped inputting new data except if it supported your view.

I understand that many intellectually lazy people use that process, a bit of digging, find out what the people I agree with on other subjects think about it and make a decision,...but that has nothing to do with science or skepticism.
 
Ok, let's take this in order. What particular field of Science is your degree in?

On the internet, claims of education and expertise are far too easy to make and far too difficult to proof without the exposure of a lot of personal information, more importantly, such is largely if not entirely irrelevent to the support I requested. I assure you that I can handle any references you can provide, but I promise that I will ask you for help if I run into any big words that I am unfamiliar with.


Nice dodge, I am a geologist and as I made fairly plain in your little test of my historical knowledge of plate tectonic theory I am well versed in it. Most of what I posted on the history and the methodology of the theories confirmation is not readily findable on the web. You have to KNOW what you are looking for you just can't do a shotgun search and hope to find the information.

So once again, what is your field of expertise? I am interested in what you claim because I can, with a little time, determine whether you are real or not based on your responses to my questions. Any good scientist can do that. I was able to determine quite simply that olfraud works for Evraz in Portland based on my questioning. I am curious what you are going to present.
 
Richard Fortey, "Earth, An Intimate History".

[ame=http://www.amazon.com/Earth-Intimate-History-Richard-Fortey/dp/0375706208]Amazon.com: Earth: An Intimate History (9780375706202): Richard Fortey: Books[/ame]
 
Ok, let's take this in order. What particular field of Science is your degree in?

On the internet, claims of education and expertise are far too easy to make and far too difficult to proof without the exposure of a lot of personal information, more importantly, such is largely if not entirely irrelevent to the support I requested. I assure you that I can handle any references you can provide, but I promise that I will ask you for help if I run into any big words that I am unfamiliar with.


Nice dodge, I am a geologist and as I made fairly plain in your little test of my historical knowledge of plate tectonic theory I am well versed in it. Most of what I posted on the history and the methodology of the theories confirmation is not readily findable on the web. You have to KNOW what you are looking for you just can't do a shotgun search and hope to find the information.

So once again, what is your field of expertise? I am interested in what you claim because I can, with a little time, determine whether you are real or not based on your responses to my questions. Any good scientist can do that. I was able to determine quite simply that olfraud works for Evraz in Portland based on my questioning. I am curious what you are going to present.

Typical, look at the "counter arguments"...
one picks 2 Years out of a decade that suit this "science"...Fortune Tellers and Nostradamus "We told You so" Idiots by the way do the same thing, .....
and the other one keeps posting the same retarded URLinks to the same retarded Web-Sites over and over again like a mindless Tibetan prayer- mill.

@"OldRocks" and other assorted Hippie "Scientists" :
If You cant` answer a question posed in Your own words and all You can do is post the same URLinks to pre-chewed FAQ`s idiotic "counter arguments" why are You even here in this forum?

It`s not as if we need You to tell us where to find what in the internet!

So why don`t You post a few links here that have an answer to these 3 questions..:
1.) Rain water always had and always will have a pH of 6.2 because condensing water absorbs CO2..where is all that CO2 in Your "climatology accounting" methods...?

Do You have even the vaguest idea how titanic the amount of CO2 that goes that way is..?
Of course You don`t because none of You are able to do simple math how to solve n reverse from the negative decade Log in g-mol of H+ Ions [grams per Liter] and the
PKa of H2CO3 how huge these amounts are, considering just the constant rainwater supply which keeps our river flow rates what they are!

And because You can`t find one of You Moron Web Sites that could give You the answer to questions like this, ...
You are making retarded remarks about people who do know how to calculate that..!

2.) Why is all the CO2 "found" in the atmosphere reported as "Molar, moisture corrected ppm" and not as ppm weight per Volume or ppm volue per volume...which would be a heck of a lot lower than the way they choose to report it...

3.) If You have a building with X cubic feet of air how many BtU`s does it take to raise the Temp by 1 Degree?
...then if You add + Y cubic feet of CO2, You still insist that warms up quicker now?

Or are You saying the CO2 we "pumped" into our atmosphere somehow replace the air and the total #of tons of all gasses stayed the same as before?...and the air was somehow replaced by CO2...???...and defied gravity and vanished into outer space...like OldRock`s "oceans" which were once on Mars..!

Even if You have no idea about Wave & Quantum Physics or Lambert/Beer Absorption laws You should have a few blinking brain cells that signal that there are some severe defects with Your bird-brain and with this "climate-science"
 
Last edited:


It's nice to see they mentioned Motonari but my version has far more information and IMO is more entertaining as well as more informative, there is no mention of the Dutch, the Subs, the towed magnetometer Runcorn etc.

In other words you just reinforced what I said, thank you for the assist!

Yeah, that`s how it`s done..somebody like OldRocks will out-do a Geologist with a life long experience in the field by simply posting a URLink to a Geology discussion web site he googled and found!...which is supposed to mean, he knows what he is talking about.

Back to the subject, "gw is a lie"
I just want to add this:
CO2 Mol per liter 3.36 × 10−06 , at ph 6 that = 1.6128 grams CO2 per cu-meter Water.
122.4 tons CO2 per hour, scrubbed by rainwater that flows just down the Mississippi
Rainfall Data, Monsoons, India:
http://www.iges.org/india/partha.subdiv.data

1270.4 mm =1.270 meters Area of India=3287240km2

6 733 944 tonnes CO2 that just got scrubbed by 1 single monsoon over India alone

United States daily CO2 emissions,latest Data is 2 6123 595 tonnes CO2 per day


Carbon dioxide - Wikipedia, the free encyclopedia
It is estimated that volcanoes release about 130–230 million tonnes (145–255 million tons) of CO2 into the atmosphere each year.

So You see if rain water would not scrub the CO2 we would have a toxic CO2 concentration on our planet for millions of years already.

The Mauna Loa "climate scientists" refuse to incorporate any CO2 data that does not fit into the "grand picture" they are trying to paint any more than they do it with the temperature data.
This is all what`s left after they wash it

CO2_increase_rate.png


And then it`s "computer model washed" some more and quoted by freaked out Internet "educated scientists:...:

co2_trend_mlo.png


And because of the NOAA logo in the pretty picture it must be "science"

"Science" which asserts we are melting so much polar ice that the oceans will rise and rown every body in New York, but in their "computer model" all that new water stays like distilled water with no salinity and zero % CO2 content


They do the same crap with the CO2 analysis as with the temperature...
You tell me how You get a 0.1 degree accuracy with garbage data sourced from this

ushcn-surveyed-7-14-09.jpg

crn_ratings.png


The blue ones with a maximum accuracy of 1 Degree...You can count with the fingers on one hand...
and the rest is a mess of data where the in`-accuracy is more than 2 degrees, as an inspection revealed.


Watts_fig23.png


MarysvilleCA_USHCN_Site_small.jpg


And they feed You garbage that in essence is the same as claiming if You average 1000 cheep Timex watches,

3053998838_538cdb0042.jpg


there is no need for something only "Oil Lobby scientists" use if they want to measure time with precision accuracy:

Gibble_AtomicClock.jpg


They also don`t need any Precision Spectral Instrumentation to tell You how much CO2 could possibly absorb of the total IR in sunlight:
TT-SMS_1.jpg


They take "average temperatures" with methods as shown above and draw You a CO2 graph which was washed twice from all of the CO data that did not fit the picture and
"prove" how much more IR the little bit of CO2 absorbs:
co2_temp_1900_2008.gif


And not a single one of these fuck ups have ever even seen a Spectrograph, forget about even knowing how to operate one!
But publish tons of bullshit all over the internet which is being quoted by utter Morons here over and over again
 
Last edited:
I`ll just copy and paste a few things here, not that there is any hope TV and Internet "science grads" will comprehend any of it, but there are a few readers here who do have an academics degree in science.
Pan evaporation data has been collected carefully and very accurately around the globe for ~ 50 years and is on a head on collision course with the "Global warming" faked data
:

434px-Evaporation_Pan.jpg


So a new dooms day prophecy had to be invented "explaining" this huge discrepancy:
GLOBAL DIMMING for Dim-wits:

http://en.wikipedia.org/wiki/Global_dimming

Global dimming is the gradual reduction in the amount of global direct irradiance at the Earth's surface that was observed for several decades after the start of systematic measurements in the 1950s. The effect varies by location, but worldwide it has been estimated to be of the order of a 4% reduction over the three decades from 1960–1990. However, after discounting an anomaly caused by the eruption of Mount Pinatubo in 1991, a very slight reversal in the overall trend has been observed.[1]
It is thought to have been caused by an increase in particulates such as sulfate aerosols in the atmosphere due to human action.


Yes the same aerosols that have in other enviro-wacko-"science" disappeared and that`s why the ozone hole has closed, have increased again, but changed their mind and instead of attacking Ozone they now dim the planet


Want some more examples how this Hippie "science" is full of contradictions...?
You can`t have it both ways, either we warmed up and "melted" the ice on the poles or we cooled down because areosols cause "global dimming" and that`s why the pan rates are down and less solar radiation is causing that...but hey at the poles and with the "ice melt" the same "logic" gets a bit inconvenient:


Pan evaporation - Wikipedia, the free encyclopedia

Over the last 50 or so years, pan evaporation has been carefully monitored. For decades, nobody took much notice of the pan evaporation measurements. But in the 1990s scientists spotted something that at the time was considered very strange; the rate of evaporation was falling.[8] This trend has been observed all over the world except in a few places where it has increased.[9] [10] [11] [12]

Of course they can explain that away right easy, assuming they can make an ass out of real science, same wiki "knowledge base"...for morons:
s the global climate warms, all other things being equal, evaporation will increase and as a result, the hydrological cycle will accelerate [13]. The downward trend of pan evaporation has been linked to a phenomenon called global dimming.[14] [15]In 2005 Wild et al. and Pinker et al. found that the "dimming" trend had reversed since about 1990 [16]

3.4.4.2 Surface Radiation - AR4 WGI Chapter 3: Observations: Surface and Atmospheric Climate Change
The Dimming of the Planet and Apparent Conflicts in Trends of Evaporation and Pan Evaporation
There has been an increase in clouds and precipitation, which reduce solar radiation available for actual and potential evapotranspiration but also increase soil moisture and make the actual evapotranspiration closer to the potential evapotranspiration. An increase in both clouds and precipitation has occurred over many parts of the land surface (Dai et al., 1999, 2004a, 2006), although not in the tropics and subtropics (which dominate the global land mean; Section 3.3.2.2). This reduces solar radiation available for evapotranspiration, as observed since the late 1950s or early 1960s over the USA (Liepert, 2002), parts of Europe and Siberia (Peterson et al., 1995; Abakumova et al., 1996), I


Not even a junior would be caught dead to publish crap like that...

I am not even going to waste my time typing how retarded this "theory" is and "Wild et al.
the Name could not be more suitable for yet another S.W.A.G.... :
which does not have a snowballs chance in Hell, let`s see how quickly "Wild et al. Pinker et al." `s tail feathers were ripped out.

CO2 Science

Widespread measurements of the flux of solar radiation received at the surface of the earth have been made since the late 1950s, with nearly all of the measurements revealing a sizeable decline in the surface receipt of solar radiation that was not reversed until the mid-1980s (Wild et al., 2005). During this time, there was also a noticeable dip in earth's surface air temperature, after which temperatures rose at a rate and to a level of warmth that climate alarmists claim were both without precedent over the past two millennia, which phenomena they attribute to similarly unprecedented increases in greenhouse gas concentrations, the most notable, of course, being CO2.

This reversal of the decline in the amount of solar radiation incident upon the earth's surface, in the words of Wild et al., "is reconcilable with changes in cloudiness and atmospheric transmission and may substantially affect surface climate." In what way? Wild et al. say that "whereas the decline in solar energy could have counterbalanced the increase in down-welling longwave energy from the enhanced greenhouse effect before the 1980s, the masking of the greenhouse effect and related impacts may no longer have been effective thereafter, enabling the greenhouse signals to become more evident during the 1990s."

Qualitatively, this scenario sounds reasonable; but when the magnitude of the increase in the surface-received flux of solar radiation over the 1990s is considered, the statement is seen to be rather disingenuous.

Over the range of years for which high-quality data were available to them (1992-2002), Wild et al. determined that the mean worldwide increase in clear-sky insolation averaged 0.68 W m-2 per year, which increase they found to be "comparable to the increase under all-sky conditions." Consequently, for that specific ten-year period, these real-world data suggest that the total increase in solar radiation received at the surface of the earth should have been something on the order of 6.8 W m-2, which is not significantly different from what is implied by the satellite and "earthshine" data of Palle et al. (2004), although the satellite data of Pinker et al. (2005) suggest an increase only about a third as large for this period.

Putting these numbers in perspective, Charlson et al. (2005) report that the longwave radiative forcing provided by all greenhouse gas increases since the beginning of the industrial era has amounted to only 2.4 W m-2, citing the work of Anderson et al. (2003), while Palle et al. say that "the latest IPCC report argues for a 2.4 W m-2 increase in CO2 longwave forcing since 1850." Consequently, it can be readily appreciated that the longwave forcing of greenhouse gases over the 1990s would have been but a fraction of a fraction of the observed increase in the contemporary receipt of solar radiation at the surface of the earth.

To thus suggest, as Wild et al. do - i.e., that the increase in insolation experienced at the surface of the earth over the 1990s may have enabled anthropogenic greenhouse gas signals of that period to become more evident - seems just a tad incongruous, as their suggestion implies that the bulk of the warming of that period was due to increases in greenhouse gas concentrations. This incongruity is made all the worse by the fact that methane concentrations rose ever more slowly over this period, apparently actually stabilizing near its end (see Methane (Atmospheric Concentrations) in our Subject Index). Consequently, a much more logical conclusion would be that the primary driver of the global warming of the 1990s was the large increase in global surface-level insolation.

Sherwood, Keith and Craig Idso

References
Anderson, T.L., Charlson, R.J., Schwartz, S.E., Knutti, R., Boucher, O., Rodhe, H. and Heintzenberg, J. 2003. Climate forcing by aerosols - a hazy picture. Science 300: 1103-1104.

Charlson, R.J., Valero, F.P.J. and Seinfeld, J.H. 2005. In search of balance. Science 308: 806-807.

Palle, E., Goode, P.R., Montanes-Rodriguez, P. and Koonin, S.E. 2004. Changes in earth's reflectance over the past two decades. Science 304: 1299-1301.

Pinker, R.T., Zhang, B. and Dutton, E.G. 2005. Do satellites detect trends in surface solar radiation? Science 308: 850-854.

Wild, M., Gilgen, H., Roesch, A., Ohmura, A., Long, C.N., Dutton, E.G., Forgan, B., Kallis, A., Russak, V. and Tsvetkov, A. 2005. From dimming to brightening: Decadal changes in solar radiation at earth's surface. Science 308: 847-850.

Doh?
homer-simpson-doh.gif
 
Last edited:
I agree with polarbear on the topic of CO2 measurements. it is certainly not as cut and dried as we are told.
 

Typical ! Can You read more than 3 word sentences and comprehend them?
What season is this right now?
Does it look green or white outside this time of the year?
Are there any major rainfalls this time of the year?

Do You think we need You to tell us where to find these idiotic "current CO2 levels"..?
Do You know how big the difference is between "molar moisture corrected CO2 ppm" and
what it actually is in ppm w/v?

Of course You don`t!

I was right when I wrote that neither You or anyone else who falls for all this Hippie "science" would be able to comprehend anything that was just posted here.

Read it!
http://www.co2science.org/articles/V8/N41/EDIT.php


Your copy&paste mouse brain answer just underlined that again!

All that`s missing is another URLink pointing to a GW temperature graph in the light of this:

Watts_fig23.png


And then You will have completed Your certification process as a complete idiot.
 
Last edited:

Typical ! Can You read more than 3 word sentences and comprehend them?
What season is this right now?
Does it look green or white outside this time of the year?
Are there any major rainfalls this time of the year?

Do You think we need You to tell us where to find these idiotic "current CO2 levels"..?
Do You know how big the difference is between "molar moisture corrected CO2 ppm" and
what it actually is in ppm w/v?

Of course You don`t!

I was right when I wrote that neither You or anyone else who falls for all this Hippie "science" would be able to comprehend anything that was just posted here.

Read it!
CO2 Science


Your copy&paste mouse brain answer just underlined that again!

All that`s missing is another URLink pointing to a GW temperature graph in the light of this:

Watts_fig23.png


And then You will have completed Your certification process as a complete idiot.


No, he can't. Nice bitch slap though!
 
@Westerwall, IanC, Mathew,Skookerasbil & many others who rather read about real science..:
A record-high ocean bottom pressure in the South Pacific observed by GRACE
In late 2009 to early 2010, the Gravity Recovery and Climate Experiment (GRACE) satellite pair observed a record increase in ocean bottom pressure (OBP) over a large mid-latitude region of the South East Pacific. Its magnitude is substantially larger than other oceanic events in the Southern Hemisphere found in the entire GRACE data records (2003–2010) on multi-month time scales. The OBP data help to understand the nature of a similar signal in sea surface height (SSH) anomaly observed by altimetry: the SSH increase is mainly due to mass convergence.
Pazifik: Forscher entdecken riesigen Wasserhügel - SPIEGEL ONLINE - Nachrichten - Wissenschaft
image-104917-panoV9-pbli.jpg

Forscher entdecken riesigen Wasserhügel
Nur sechs Zentimeter hoch - und doch eine Besonderheit: Im Südpazifik war das Meer auf einer Fläche so groß wie Australien monatelang deutlich angeschwollen. Wissenschaftler staunen über den Rekord. Jetzt haben sie die Ursache des Hügels gefunden.
Die Messungen stammen von den beiden "Grace"-Satelliten, die die Erde in rund 300 Kilometern Höhe umkreisen. Sie messen die Erdanziehung: Orte mit höherer Schwerkraft beschleunigen die Sonden. Den "Grace"-Satelliten und ihrem Nachfolger "Goce" verdanken Forscher genaue Karten der Erdanziehungskraft. Die Atlanten zeigen, wo Bodenschätze, Grundwasser oder Magmaströme liegen, und sie erklären, warum wir an manchen Orten auf der Erdoberfläche weniger wiegen als anderswo.

Okay here they say "Grace" and "Goce" are primarily deployed to detect gravitational force variations to locate valuable metal deposits, magma flow and large underground fresh water deposits. But they have found this 6 centimeter high water hill (in blue color) on the picture above.
Now they realize that these "water-hills" are responsible for prolonged warm water currents that feed the arctic and the antarctic and ...of course bring prolonged mild temperatures with them.

So now we are all waiting for "climatologists" to find a link between the gravitational disturbance "water hills" and man made CO2.
I`m sure we won`t have to wait long, after holding a summit and smoking a few joints in Holland, where it`s legal, they`ll come up with yet another new "theory", which OldRocks will post soon after as a proven fact...
won`t You "OldRocks"..?

I could suggest one, CO2 attracts water...put CO2 in a bottle and submerge the bottle opening slightly below the water surface..You`ll see a
n fountain, ...because there is indeed a strong attraction between CO2 and H2O.!!!
So the CO2 from my V8 van exhaust maybe pulls up the ocean...maybe that`s how Your Martian Oceans went out into space and were sucked down to earth after Moses made a few smoke signals sacrificing Chickens and goats?......and drowned the evil Arabs who were going to sell crude Oil...
 
Last edited:
and what else would we expect from biPolar.


Factual information, amusing anecdotes, some damned impressive photographs, relevent links to very useful, informative websites, very interesting videos and some good humor!


What have you got? More antiquated irrelevent, false alarmist links? Yep, that's what we thought you had.
 
Thank`s for watching my back. I wonder why "OldRocks" is so fixated on this "bi-polar" thingy, it`s almost as if he has a fetish for some words.
If I had the time for it I would search for the posting where he did his best to ridicule everybody where the Bio-Ethanol Gas was discussed in one of these climate threads.

I guess he`ll never know how out-dated the "information" really is and these silly URLinks he keeps here over and over again..:
I wonder if he even reads any news papers that are half ass neutral, because I`m sure that must have been reported by Reuter`s also...the BBC had it, but I kind find it right now in their Archives..,...it is in there though... The "Der Spiegel" online had it again today, because in Germany heads are rolling now over this screwed up "enviro-propaganda-pseudo-science" which had been legislated and have almost ruined Germany`s infrastructure...here is "OldRock"`s hero, Al Gore today...his vote it seems was on August 1994 the deciding vote in the Senate and later again the deciding vote to legislate a 7.7 Billion$ subsidy for "Bio-Ethanol"

And lately Al Gore did a 180 degree turn.:
(I think there should be a law holding Bastards like that accountable to the damage they did)


Streit*über Alternativ-Benzin: Wie Umwelt-Guru Gore zum Biosprit-Gegner wurde - SPIEGEL ONLINE - Nachrichten - Wirtschaft
Wie Umwelt-Guru Gore zum Biosprit-Gegner wurde

How the Environment Guru-Gore was transformed to a Bio-fuel enemy

But for Years we have been lectured by him and the likes of him, and everybody who said then what finally dawned on him too, was "ignorant" and all kinds of other things...

Well, and that`s the way it`s been going with everything else that has been put to a real world test with this entire lunatic "science".

And some of the "defenders" are still in jungle caves like the Japanese who haven`t heard the news.

If I had the time I would catalog all the crap, this user "OldRocks" has posted in this forum and put it right along side articles just like this one, to cement his feet, Mafia style, in the positions he chose and see how well he and his ideas float when reality catches up with the lies.

But unfortunately other than the Mafia nobody does that, else we would have no more problems and no more liberals.
GW and liberal propaganda demands chivalry from their opponents and rely on the fact that You can`t nail pudding to the wall...and that`s what keeps it going
 
Last edited:
I looked around a little bit in the other threads and the bullshit that is quoted & spread by the likes of "OldRocks" and "Chris" has long been abandoned by the very same people they still quote.
The melting arctic ice won't raise the sea level.

The ice in Greenland and Antarctica will.

I `ve been stationed on Greenland many Years and all of us who went there, thought that Greenland was in the Arctic and brought Parkas...
Where is it then, in the tropics?

Where exactly is ice MELTING and not CALVING in the Antarctic ???????????


You guys have no idea how stupid You are! The very "climatologists" You keep quoting had conceded these claims already over a year ago!...after their claims had bee scrutinized. That`s the way this whole bullshit works...! You can fabricate a claim in a few minutes, but it is a lot more work and time consuming to check up on all these wild ass claims. And that is exactly what these bullshit-flingers exploit.
So how did that claim with the "thinning and faster melting ice" actually check out...?....:
6a010536b58035970c0120a8112ef1970b-pi

C3: ? Are Ice Sheets Going To Disappear
Latest Research From EU Finds IPCC Predictions of 'Ice-Free' Arctic To Be Bogus Alarmism

6a010536b58035970c0148c6954f23970c-600wi

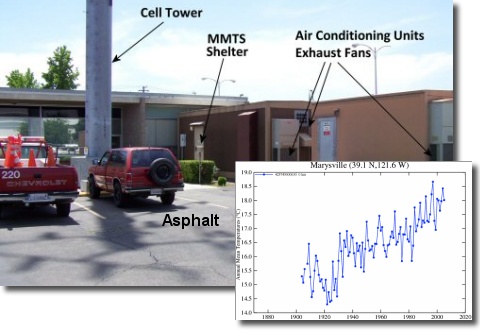
The left image indicates the corrected decadal temperature trends, which are miniscule: from -0.5 degrees to +0.5 degrees per decade. The right image is from the 2009 study, designed to show significant Antarctic warming across the entire continent.


No matter what claim You do check out, it turns out to be either totally faked or "computer model"..."data", whatever the fuck that is...as if it is acceptable to feed fake data into a totally stupid computer model, where the only laws of physics are the ones that suit your claims.
Even what "climatologists" call Peer Review has been re-defined by them, meaning the claims + fake data is being "reviewed" by "climatologists"...excluding all other established science...
And when it is reviewed by others, then so far "climatologists" took one beating after another..
.of course that can be explained...all other scientists are in a conspiracy with the "Oil Lobby"...
So here is a real Peer Review, a procedure that any scientist than "climatology" finds when examining these SAWG`s...:
C3: 1 Peer-Reviewed Studies

Even "White et al. had to drop their claims in the meantime and try to use man made aerosols and "global dimming" ...; which was the "Global dimming" cop-out...another wild ass guess which quickly was incorporated as a "proven fact" in theses idiotic computer models to "explain" the true temperature data...
Yet "OldRocks" and "Chris" even now keep quoting the same stupid temperature trends the fakers have long since abandoned and wish now they had never published these...just like the "Bio Fuel" claims.

And now this latest fraud about the "accelerated ice melt" was exposed as well

2010 Study By Arctic Experts Refutes AGW Hypothesis of Polar Warming Amplification From CO2
The nine researchers [White et al. 2010] examined all the evidence and research related to Arctic temperatures and determined that current Arctic temperatures are well within natural variability and no CO2-induced "polar-amplification" is to be found.


"OldRocks" and some others are not exactly up to (escape)-speed with this "science" and the quotes they use become outdated and replace with newer wild ass guess theories...


And it goes on and on, no matter which wild ass claim You check up on...:
This new peer-reviewed research regarding the Hudson Bay sea ice issue indicates there is actually no trend of earlier sea ice breakup in the area. The data analysis does show, though, a one-time shift to an earlier breakup date during late 1980's, but no trend prior or post to that event that can be attributed to AGW causes.

"Working with passive microwave data obtained from the Scanning Multichannel Microwave Radiometer on-board the Nimbus 7 satellite, plus three Special Sensor Microwave/Imager instruments onboard Defense Meteorological Satellite Program satellites -- as well as Canadian Ice Service sea-ice charts that are considered to be "more accurate than passive microwave data for estimates of ice concentration, particularly in the presence of surface melt,".....the two researchers from the British Antarctic Survey found that "there has clearly not been a continuous trend in the [time of sea-ice breakup] data, and the change is best described by a step to 12 days earlier breakup occurring between 1988 and 1989, with no significant trend before or after this date." ...

Well somebody with a lot more patience than I`ll ever have took the trouble and made an up to date list of the latest crap claims and how they faired:
http://www.c3headlines.com/are-antarcticgreenland-about-to-totally-melt/]C3: ? Are Ice Sheets Going To Disappear[/COLOR]

@"OldRocks" here again is how glaciers "melt"...fuck, are there no limts to Your stupidity?..

800px-Glacier-ice_shelf_interactions.svg.png


I showed this to a grade 6 school class today...not a single Kid nor the regular teachers had any problems understanding this...

Have You ever looked at the gradient iso-topic lines of Greenland where your climaquackery likes to observe "CO2 glacier melting"...?,
080929093754-large.jpg


of course not, but I`ll post one here, put on your blindfold!


gto_0093_0027_1.jpg


Even a 12 year old would understand it:

Glacier Movement

Why do they move?

Once a mass of compressed ice reaches a certain thickness, usually around 20 meters / 66 feet thick, it becomes so heavy that it begins to change shape and move. The pressure from the sheer bulk of the ice, combined with the pull of gravity, causes the glacier to flow downhill very slowly - creeping along and bending like an ice river.

I.Q. definition...:
intelligence quotient: a measure of a person's intelligence as indicated by an intelligence test; the ratio of a person's mental age to their chronological age (multiplied by 100)


We all know Your mental age, all we need is for You to volunteer us Your chronological age

I looked into Your personal profile just now ..:
He does not seem to like You very much:
avatar25946_1.gif

glew
Dude! You got something to say then bring it to the flame zone...otherwise, stay out of my profile.


And about yourself You say..:

I am an active, pretty much physically average man.
Portland, Ore.
Occupation
Millwright, in a steel mill

As far as estimating Your I.Q. , so maximum Your chronological age is 64 and minimum ~25. The school class I showed this stuff today were 11 year olds but they understood it.
So let`ds give You a 10, that would put You between 40 and 15 on the I.Q. scale.
Moron = by definition I.Q. Range 51-70...I have mistakenly called You a Moron so far,
That won`t happen again. You are squarely center range...:Imbecile ---- IQ 26-50
And You a millwright?...no way!


So in which of these Steel Mills in Oregon You work in, as a "Millwright"?.... as You say

data=LtgX-e3f8ctI3U5dJtbt7EJ1ZfRneYme,gKUj-dA-HH_g1wT3RMLWXOe6RMryxwWdoEDyFxgFSbiXJLxaY7KJsol65gxW5BwLtZB5WNh-caAiDsNiLmxJuGn5KVBZGVFpzN8lCOhPWO4j0kNNZWAaFj14x-en-M0x2qixtmySh_EBm7GTQl5j74sRMJlcaCylAXD-s-3ePSTw2qO_h13dTelrPvNWepEE5hU_-MQWyHqI1kNlKsLvK4BhD0BMXu5LoKvcT8PyR0GgUEd2-XAmKKieDlti6F-3JM34lFGcxmzK-SHSNj2YJ20JDRH7lROnneh_MbOa1kSefpjI2YywUlhIuCiv5MptIRv4Xu_uQkGT79vQbNWPVX1WlD0ItVdRiJrV_gRSRax9PDjR1HgrFrxQDUOHDZ_4QyNNR5G7n6tNt8y_F5JPtyCbJo2cqbXnK58ADiK6FhANGctw1MHeQodFdlOtuUWIOBT4nuFAS7L1AsbZTexI38eyM6VmDM6pMSIfF3fpKHLQUTesPw


I got some friends right next door from you, on the Comox Military Base across the border and maybe Your personal claims need to be checked out the same as the quackology You keep posting here ..
Naah let`s just do it this way..:

A REAL millwright would know this:
When do You not use a welder in DC mode..?

Having a little trouble finding it in Wikipedia?...
Well I guess someone in Portland will eventually tell You, like a real Millwright!
Whatever, I don`t need to wait. A while ago when we were discussing Windmill power grids You had no idea about phase angles and power factors. I never checked into Your profile then..and a real millwright would have never replied as stupid as you did, because a real millwright has to know elementary stuff like that

But now that I know where You are I also know where You get all these crackpot Ideas from.
Portland is even worse than Vancouver. Nothing but dope-heads and and a dope farm on almost any hill side facing south.
Nowhere else have I seen so many basket cases STONED in the middle of the day in the middle of the road


medipot-states.gif


And what the fuck would someone in Portland know about the arctic other than the internet garbage You keep posting here.
In Portland and Vancouver You can wear shorts and play golf in January, pick "magic mushrooms" and get stoned!

I don`t believe for 1 second You are a millwright, way more likely is You are selling the same stuff You are growing and smoking.
I `m willing to bet You run an "indoor grow greenhouse" in Your basement and have solar panels on Your roof, hoping the power consumed by your UV growing lamps does not tip off the hydro man and the cops.
Of course You being another GW Apostel explains your solar panels..but did You know that in BC the RCMP uses Helicopters with UV sensitive scanners that look for stray UV light coming out of houses, especially what comes out of basements!
You can spot it from +10 000 feet!
They do that since solar panels on roof tops are more common. Before that it as mostly the indoor dope growers that used these, nobody else did with hydro in Canada being dirt cheep!
Take it from me, it is true, because we (, my buddies in the Military @ Comox) lend them the scanners and the Helicopters!
I`ve even been along for some joy rides. Dale Gibson, a real big-shot (as in Gibson`s Landing) in Sechelt on the Sunshine Coast not far from where You are got nailed only 4 Years ago just like that!
I enjoyed every second of it !
So You better buy a lot of duct tape and hope You did not miss even the slightest gap!
0.jpg

Portlandpolice-SWPortlandMarijuanaBust723.jpg
 
Last edited:
Nice dodge, I am a geologist and as I made fairly plain in your little test of my historical knowledge of plate tectonic theory I am well versed in it. Most of what I posted on the history and the methodology of the theories confirmation is not readily findable on the web. You have to KNOW what you are looking for you just can't do a shotgun search and hope to find the information.

So once again, what is your field of expertise? I am interested in what you claim because I can, with a little time, determine whether you are real or not based on your responses to my questions. Any good scientist can do that. I was able to determine quite simply that olfraud works for Evraz in Portland based on my questioning. I am curious what you are going to present.

No dodge, simply irrelevant to the discussion, and something that is ultimately without possible verification with out sharing personal information that goes beyond what I generally share with people I don't know on public internet discussion boards. I source and support my understandings with mainstream science and academic references.

As far as my personal understandings, though a bit rough around the edges after four decades, I can still manage at least graduate level understandings in various maths, chemistry and physics with perhaps lessor undergraduate level understandings of computer networking, astronomy, biology and health sciences, though most of the decades since my last rigorous degree work has been spent in the US Military and the private sector as a government contract management specialist helping smooth the efforts and coordination between private groups who bid for government research and initial development contracts and the government agencies offering the contracts. Much more business (paperwork and red tape) than science but such is the pursuit of a paycheck.

As stated before, if you use any big words I don't understand or for which I can't find an appropriate explanation, I've no problem asking about it. This isn't about personal qualifications, this is about mainstream scientific understandings and the support of one's statements with verifiably authentic and reliable mainstream science references and evidences in a compelling manner.
 
6a010536b58035970c0148c6954f23970c-600wi


trakar- have you examined the story behind these two pictures? one is the faulty paper that made the front page of Nature and the other is the paper that destroyed the use of faulty methodology in that first paper. which one got more publicity? which one went through peer review which actually looked at the paper? and most importantly, which paper didnt get retracted from Nature and which paper couldnt get published in Nature?
 

Forum List

Back
Top