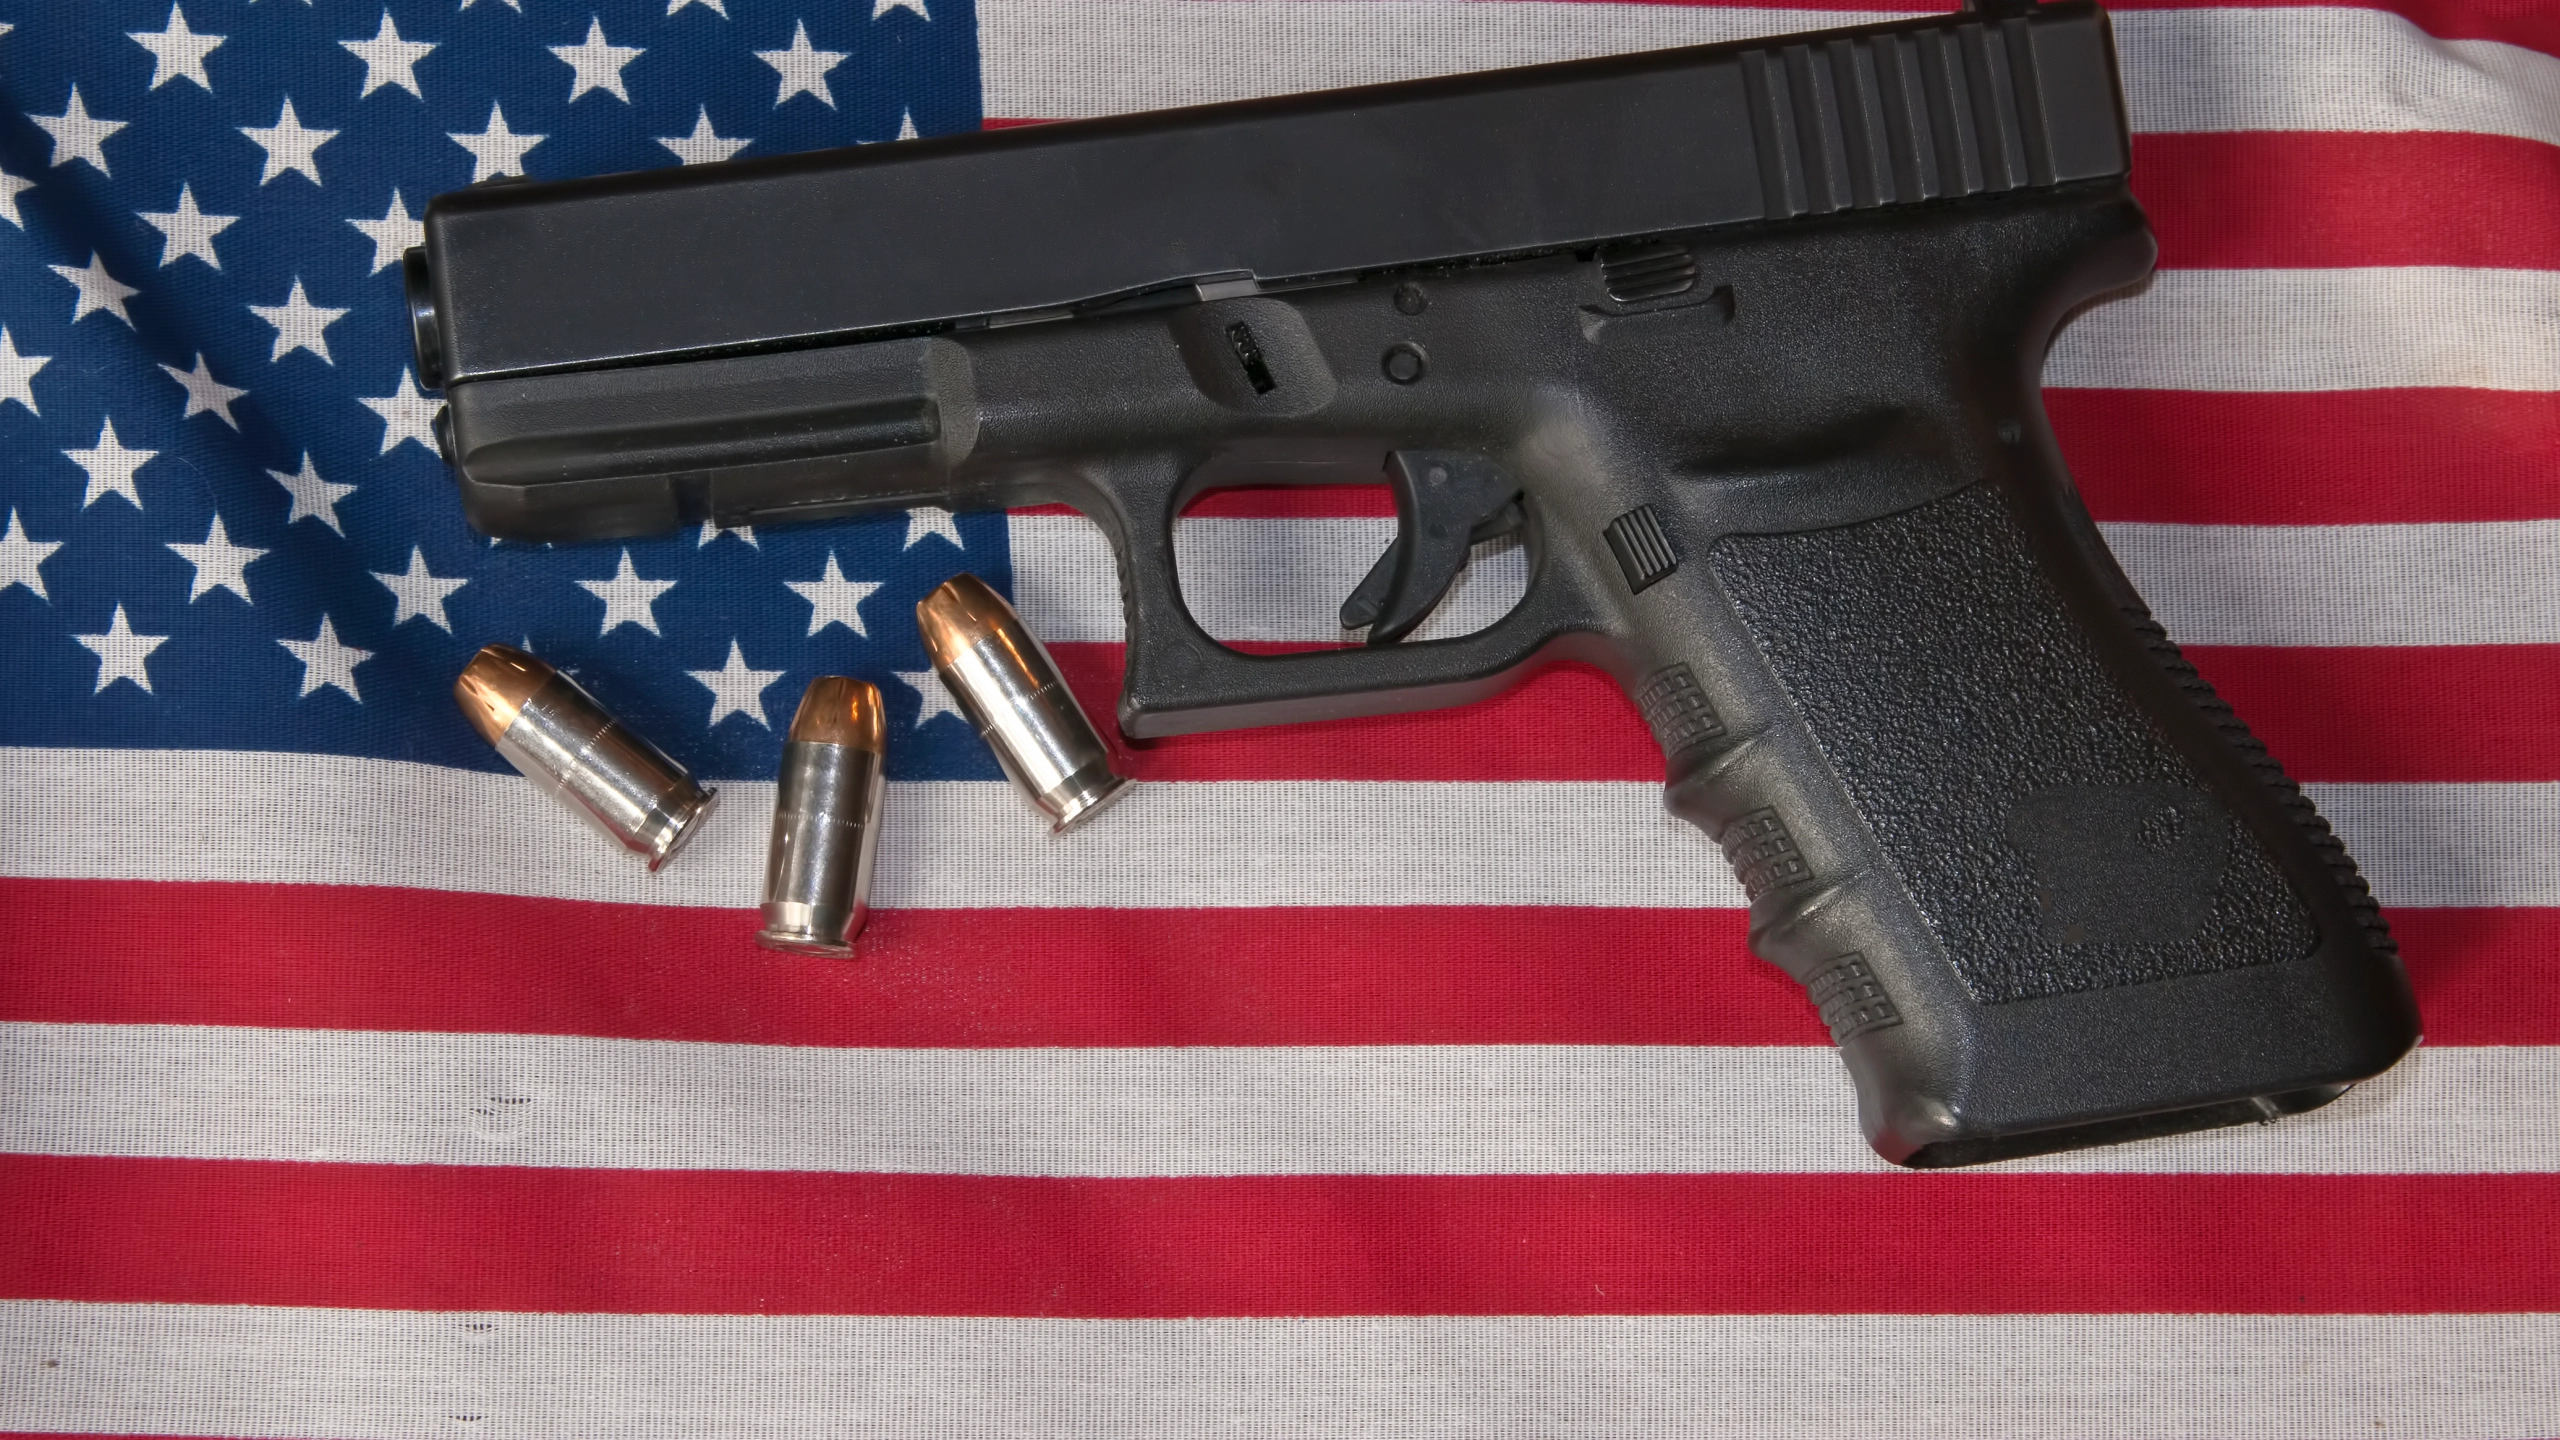
Guns prevent crimes

Suicide by gun is the most common here and by far the most successful method. The decision to finally act is usually impulse driven and with a gun irreversible. It’s an American problem which could be reduced with a waiting period allowing a person to reconsider and get help.
Virtually zero people who commit suicide buy a gun for that purpose
How will a waiting period make a difference?
 
Gun policies and the criminal justice system are primarily state driven. The rise in violent gun deaths also correlates with the intentional loosening of gun restrictions by Republicansand a reckless self serving gun lobby.
1993-2018, gun-related violence fell 55%
This correlates with the states loosening of gun restrictions, especially restrictions on concealed carry, by Republicans.

 
Weapons can protect. But in terms of the gross wickeness of Congress, millions of people have been been tortured, maimed and murdered by the shit head Congressmen over the last 123 years.
 
Tell this to the families whose children were murdered in classrooms in all of the Several States since Columbine in 1999.
you mean the classrooms that werent protected with guns??

they would still be alive if they were protected instead of hung on a string for any bad guy to kill at will,,
 
Gun policies and the criminal justice system are primarily state driven. The rise in violent gun deaths also correlates with the intentional loosening of gun restrictions by Republicansand a reckless self serving gun lobby. States with the loosest gun laws have the highest rates of gun deaths.


Yet the highest rates of gun violence are in Republican run states.


Guess what happened?

View attachment 727727


The graph above is what the data says about gun deaths. Can’t make it any plainer.
What the data says about gun deaths in the U.S.

At the same time Republicans in red states were loosening gun laws. Blue states with big cities like CA and NY have among the lowest rates of gun deaths.


No...it doesn't. You are propgating the lie about Red states vs. Blue Cities...you lying doofus.


From poster, Toobfreak.

I chose 58 cities as that was the largest number I could fit on a page. I then went through each city one by one to look up the major of every city. Aside from the fact that you can forget finding any pattern of cities in "red" states being the most with the highest crime as the idiot Marc tries to claim, but I went down the list marking all the mayors of the highest crimes cities in America in BRIGHT RED who were DEMOCRATS.


Look at what I found:


Screen Shot 2022-10-05 at 7.02.25 PM.png


Every city above in red is RUN BY A DEMOCRAT!

Murder map: Deadliest U.S. cities


This lie you guys keep pushing has been exposed over and over again, but like your cousins from the 1930s in Germany, you believe telling a lie often enough makes it true....


The reason gun crime rose, primarily in Blue Cities is the policies of the democrat party....

1) Attacking the police to the point they stopped doing their jobs, quit, or retired.

2) "Decarceration," as an active policy of the democrat party, releasing violent criminals from custody....with no cash bail, and reducing penalties for any crime they can find.......
 
Thing is, these are ESTIMATES.

If we look at the reality, the REAL STATISTICS, what do we see?

Murder rate at 5.0 (or 6.3) per 100,000 people.
for the UK it's at 1.2


Other crimes are hard to compare with other countries because different countries record crimes differently, the US only records a few things as "violent crimes" whereas the UK records a lot more, however:


Lots of high crime rates in red states, in places with lots of guns.

Alaska has one of the highest rape rates (2nd) (rape is a difficult one though) and high gun rates, aggravated assault (9th), burglary it's 33rd out of 100, surely those guns would be stopping this crime.


And you push the lie about Red States.......it isn't Red States....it is Blue Cities...


From poster, Toobfreak.

I chose 58 cities as that was the largest number I could fit on a page. I then went through each city one by one to look up the major of every city. Aside from the fact that you can forget finding any pattern of cities in "red" states being the most with the highest crime as the idiot Marc tries to claim, but I went down the list marking all the mayors of the highest crimes cities in America in BRIGHT RED who were DEMOCRATS.


Look at what I found:

Screen Shot 2022-10-05 at 7.02.25 PM.png


Every city above in red is RUN BY A DEMOCRAT!

Murder map: Deadliest U.S. cities
 
Suicide by gun is the most common here and by far the most successful method. The decision to finally act is usually impulse driven and with a gun irreversible. It’s an American problem which could be reduced with a waiting period allowing a person to reconsider and get help.


Suicide is an Asian problem....you doofus....


Doesn't matter......... South Korea, Japan and China have massively higher suicide rates than we do.....and they have extreme gun control....

As do these European countries.

Canada....more young people in canada commit suicide


STATCanadaUnited States
Ages 15-2415 per 100,000 people
Ranked 4th. 9% more than United States
13.7 per 100,000 people
Ranked 7th.
Ages 25-3418 per 100,000 people
Ranked 8th. 18% more than United States
15.3 per 100,000 people
Ranked 10th.
Ages 35-4419.2 per 100,000 people
Ranked 8th. 25% more than United States
15.3 per 100,000 people
Ranked 12th.
Ages 45-5418.5 per 100,000 people
Ranked 10th. 29% more than United States
14.3 per 100,000 people
Ranked 13th.
Ages 55-6415.1 per 100,000 people
Ranked 11th. 14% more than United States
13.3 per 100,000 people
Ranked 13th.
Ages 65-7412.1 per 100,000 people
Ranked 14th.
15.3 per 100,000 people
Ranked 11th. 26% more than Canada
Ages above 7512.2 per 100,000 people
Ranked 15th.
22 per 100,000 people
Ranked 10th. 80% more than Canada
SOURCES: GECD Society at a Glance 2001, Statistical Annex Table D3


Canada vs United States: Crime > Suicide rates Facts and Stats

Methods in japan..


https://www.jstage.jst.go.jp/article/jea/14/6/14_6_187/_pdf


And yet Scotland has a higher suicide rate than the U.S......Japan, where only criminals and cops have guns, has a higher suicide rate than the U.S....Sweden has a higher suicide rate than the U.S....Denmark has a higher suicide rate than the u.S.....


France

Germany,

Hungary

Iceland

New Zealand

Poland

Norway

Japan

South Korea


https://www.washingtonpost.com/wp-srv/world/suiciderate.html


Scotland..


15.7 suicides per 100,000

In 2019?

16.7 suicides per 100,000.

And in the U.S.?

13.93 per 100,000


Suicide facts and figures


Changes in Suicide Rates — United States, ...


https://www.washingtonpost.com/wp-srv/world/suiciderate.html


South Korea 24.7

Hungary 21

Japan 19.4

Belgium 18.4

Finland 16.5

France 14.6

Austria 13.8

Poland 13.8

Czec Republic 12.7

New Zealand 11.9

Denmark 11.3

Sweden 11.1

Norway 10.9

Slovac Republic 10.9

Iceland 10.3

Germany 10.3

Canada 10.2

United States 10.1


A new report by Unicef contains a shocking statistic - New Zealand has by far the highest youth suicide rate in the developed world.
A shock but no surprise - it's not the first time the country tops that table.
The Unicef report found New Zealand's youth suicide rate - teenagers between 15 and 19 - to be the highest of a long list of 41 OECD and EU countries.
The rate of 15.6 suicides per 100,000 people is twice as high as the US rate and almost five times that of Britain.
 
Gun policies and the criminal justice system are primarily state driven. The rise in violent gun deaths also correlates with the intentional loosening of gun restrictions by Republicansand a reckless self serving gun lobby. States with the loosest gun laws have the highest rates of gun deaths.


Yet the highest rates of gun violence are in Republican run states.


Guess what happened?

View attachment 727727


The graph above is what the data says about gun deaths. Can’t make it any plainer.
What the data says about gun deaths in the U.S.

At the same time Republicans in red states were loosening gun laws. Blue states with big cities like CA and NY have among the lowest rates of gun deaths.


The democrats began their war on police in2015, and their policy of releasing violent criminals around the same time...which is why the crime rates in the cities they control spiked.....


You have to explain this....

Over 27 years, from 1993 to the year 2015, we went from 200 million guns in private hands in the 1990s and 4.7 million people carrying guns for self defense in 1997...to close to 400-600 million guns in private hands and over 19.4 million people carrying guns for self defense in 2019 (in 2020 that number is 21.52 million)...guess what happened...

New Concealed Carry Report For 2020: 19.48 Million Permit Holders, 820,000 More Than Last Year despite many states shutting down issuing permits because of the Coronavirus - Crime Prevention Research Center


-- gun murder down 49%

--gun crime down 75%

--violent crime down 72%

Gun Homicide Rate Down 49% Since 1993 Peak; Public Unaware

Compared with 1993, the peak of U.S. gun homicides, the firearm homicide rate was 49% lower in 2010, and there were fewer deaths, even though the nation’s population grew. The victimization rate for other violent crimes with a firearm—assaults, robberies and sex crimes—was 75% lower in 2011 than in 1993. Violent non-fatal crime victimization overall (with or without a firearm) also is down markedly (72%) over two decades.
======

The gun murder and gun suicide rates in the U.S. both remain below their peak levels. There were 6.2 gun murders per 100,000 people in 2020, below the rate of 7.2 recorded in 1974.


What the data says about gun deaths in the U.S.


This means that access to guns does not create gun crime........

Why do our democrat party controlled cities have gun crime problems?

What changed in 2015?

The democrat party did 3 things...

1) they began a war on the police that forced officers to stop pro active police work, allowing criminals to run wild.

2) they began to release the most violent and dangerous gun offenders over and over again, not matter how many times they had been arrested for gun crimes

3) they used their brown shirts, blm/antifa to burn, loot and murder for 7 months in primarily black neighborhoods while the democrat party mayors ordered the police to stand down and not stop them......in order to hurt Trump during the election.
 
The “good guy” with a gun is exceedingly rare.


Completely irrelevant. We are talking about crime in the current time period. Try to address THAT.


Irrelevant (and inaccurate)…there is also the first clause of the amendment to consider but that be a whole nother topic, not this one.


Rates of rates of gun violence indicate they are right.


Apples and oranges.


Again, apples and oranges.


None of that has anything to do with rates of violent crime, gun violence or the use of guns to prevent violence.


A 2015 opinion piece.

vs.


Gun self defense is not exceedingly rare....

A quick guide to the studies and the numbers.....the full lay out of what was studied by each study is in the links....

The name of the group doing the study, the year of the study, the number of defensive gun uses and if police and military defensive gun uses are included.....notice the bill clinton and obama defensive gun use research is highlighted.....

GunCite-Gun Control-How Often Are Guns Used in Self-Defense

GunCite Frequency of Defensive Gun Use in Previous Surveys

Field...1976....3,052,717 ( no cops, no military)

DMIa 1978...2,141,512 ( no cops, no military)

L.A. TIMES...1994...3,609,68 ( no cops, no military)

Kleck......1994...2.5 million ( no cops, no military)


2021 national firearm survey, Prof. William English, PhD. designed by Deborah Azrael of Harvard T. Chan School of public policy, and Mathew Miller, Northeastern university.......1.67 million defensive uses annually.

CDC...1996-1998... 1.1 million averaged over those years.( no cops, no military)

Obama's CDC....2013....500,000--3million

--------------------


Bordua...1977...1,414,544

DMIb...1978...1,098,409 ( no cops, no military)

Hart...1981...1.797,461 ( no cops, no military)

Mauser...1990...1,487,342 ( no cops,no military)

Gallup...1993...1,621,377 ( no cops, no military)

DEPT. OF JUSTICE...1994...1.5 million ( the bill clinton study)

Journal of Quantitative Criminology--- 989,883 times per year."

(Based on survey data from a 2000 study published in the Journal of Quantitative Criminology,[17] U.S. civilians use guns to defend themselves and others from crime at least 989,883 times per year.[18])

Paper: "Measuring Civilian Defensive Firearm Use: A Methodological Experiment." By David McDowall and others. Journal of Quantitative Criminology, March 2000. Measuring Civilian Defensive Firearm Use: A Methodological Experiment - Springer


-------------------------------------------

Ohio...1982...771,043

Gallup...1991...777,152

Tarrance... 1994... 764,036 (no cops, no military)

Lawerence Southwich Jr. 400,000 fewer violent crimes and at least 800,000 violent crimes deterred..

2021 national firearms survey..

The survey was designed by Deborah Azrael of the Harvard T.H. Chan School of Public Health, and Matthew Miller of Northeastern University,
----
The survey further finds that approximately a third of gun owners (31.1%) have used a firearm to defend themselves or their property, often on more than one occasion, and it estimates that guns are used defensively by firearms owners in approximately 1.67 million incidents per year. Handguns are the most common firearm employed for self-defense (used in 65.9% of defensive incidents), and in most defensive incidents (81.9%) no shot was fired. Approximately a quarter (25.2%) of defensive incidents occurred within the gun owner's home, and approximately half (53.9%) occurred outside their home, but on their property. About one out of ten (9.1%) defensive gun uses occurred in public, and about one out of twenty (4.8%) occurred at work.
2021 National Firearms Survey


Clinton's study by the DOJ....

https://www.ncjrs.gov/pdffiles/165476.pdf

Applying those restrictions leaves 19 NSPOF respondents (0.8 percent of the sample), representing 1.5 million defensive users. This estimate is directly comparable to the well-known estimate of Kleck and Gertz, shown in the last column of exhibit 7. While the NSPOF estimate is smaller, it is statistically plausible that the difference is due to sampling error. Inclusion of multiple DGUs reported by half of the 19 NSPOF respondents increases the estimate to 4.7 million DGUs.


n the third column of Table 6.2, we apply the Kleck and Gertz (1995) criteria for "genuine" DGUs (type A), leaving us with just 19 respondents. They represent 1.5 million defensive users. This estimate is directly comparable to the well-known Kleck and Gertz estimate of 2.5 million, shown in the last

While ours is smaller, it is staistically plausible that the difference is due to sampling error. to the when we include the multiple DGUs victim. defensive reported by half our 19 respondents, our estimate increases to 4.7 milli

While ours is smaller, it is statistically plausible that the difference petrator; in most cases (69 percent), the is due to sampling error. Note that when we include the multiple DGUs reported by half our 19 respondents, our estimate increases to 4.7 million DGUs.
----

As shown in Table 6.6, the defender fired his or her gun in 27 percent of these incidents (combined "fire warning shots" and "fire at perpetrator" percentages, though some respondents reported firing both warning shots and airning at the perpetrator). Forty percent of these were "warning shots," and about a third were aimed at the perpetrator but missed. The perpetrator was wounded by the crime victim in eight percent of all DGUs. In nine percent of DGUs the victim captured and held the perpetrator at gunpoint until the police could arrive.
 
Gun policies and the criminal justice system are primarily state driven. The rise in violent gun deaths also correlates with the intentional loosening of gun restrictions by Republicansand a reckless self serving gun lobby. States with the loosest gun laws have the highest rates of gun deaths.


Yet the highest rates of gun violence are in Republican run states.


Guess what happened?

View attachment 727727


The graph above is what the data says about gun deaths. Can’t make it any plainer.
What the data says about gun deaths in the U.S.

At the same time Republicans in red states were loosening gun laws. Blue states with big cities like CA and NY have among the lowest rates of gun deaths.


This is why we have increasing crime and murder in democrat party controlled cities.....the criminals know that the democrats are attacking the police, handicapping them, and that even when caught in attempted murder of 25 people....they will likely be releaasaed.......you doofus.

Twenty-five recruits for the Los Angeles County Sheriff’s Department got mowed down by a driver on Wednesday. Police arrested Nicholas Gutierrez for attempted murder almost immediately. Police investigators insist that they have probable cause and evidence to support those charges.
Late last night, however, Gutierrez walked out of jail — which is more than many of his victims can do, now and in at least one case for a lot longer than that.


Forum List

Back
Top