Jean S had observed:
Steve, Roman, or somebody , what am I doing wrong here? I tried to check the screening correlations of Gergis et al, and I’m getting such low values for a few proxies that there is no way that those can pass any test. I understood from the text that they used correlation on period 1921-1990 after detrending (both the instrumental and proxies), and that the instrumental was the actual target series (and not the against individual grid series). Simple R-code and data here.
filehosting.org - download page for Gergis2012.zip
I’ve re-checked his results from scratch and can confirm them.
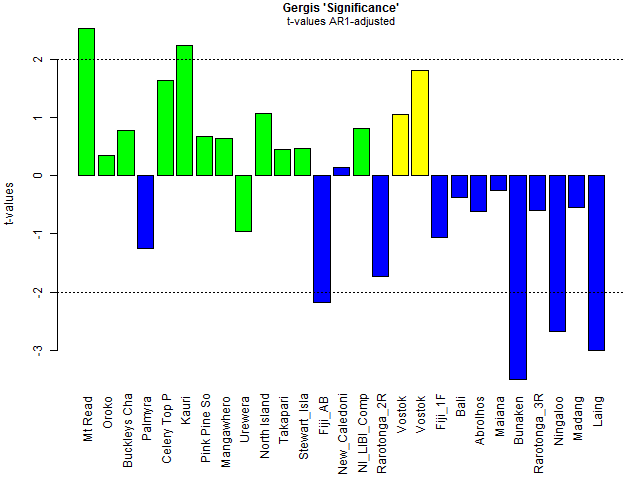
The following graphic shows t-values for a regression of each detrended “passing” proxy against the target instrumental series, all downloaded from original data. ( I got exactly the same correlations as Jean S.) These calculations calculate significance in the style of Santer et al 2008. (The AR1 coefficient of residuals of proxy~instrumental is calculated and the number of degrees of freedom adjusted. A two-sided 5% significance test (again in Santer style) has a t-value benchmark of about +-2 for series of the length of the calibration period. (It varies a little, but this is not material for the point here and t-values of +-2 are shown in the graphic.) Only six of the 27 proxies have t-values exceeding +-2.