BB's retiring is the common claim for the reduction in workforce #'s, but it goes much deeper than that.
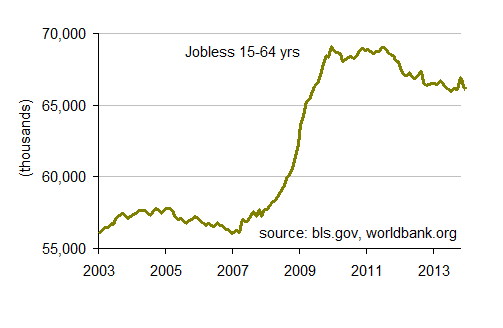
2) The bad economy is keeping workers in school and out of the labor force. Demographics can't entirely explain of the labor force fall, however. For one, the number of Americans working or actively seeking work has actually fallen faster than demographers had predicted:
And here's another clue that this isn't just a demographic story: The participation rate for workers between ages 16 and 54 fell sharply during the recession and still hasn't recovered. Obviously retirements can't explain this:
Three reasons the U.S. labor force keeps shrinking
First, your article and the Boston Fed Paper referenced in the article do agree that the biggest contributor is the baby boomer retirement, so that affirms my point. It's not even controversial or really insightful either - anyone can look at the chart and see the effect of the baby boomers entering the workforce and retiring.
Does this explain 100% of the rise and decline of the LFPR - like anything else in the economy, no. You will never run a set of data and come up with an R^2 = 1. The economy is extremely enormous (global in nature in fact) and highly complex. There is no 1 single factor that will fully explain anything, much less a single factor that explains something in such a linear fashion. I'm sure that there is
something to be said for #2 and #3 in the WaPo article.
The Boston Fed paper referenced by the WaPo was a good read. But the WaPo article incorrectly concluded that the "these non-inevitable dropouts might even account for the bulk of the decline." The Boston Fed paper actually said that the "state-level data indicates that the aggregate decline in prime-age LFPR since 2007 can be fully explained by the persistent shortfall in labor demand." That does not say that the decline in the LFPR is fully accounted for by non-inevitable dropouts. To conclude that, you would have to also include the retirees of the "Older Adults" category, which would end up showing what the paper also conceded and everyone else realizes - the bulk of the decline is due to baby boomer retirement.
The CBO concludes similarly that baby boomers account for most of the decline and, as of 2011, attribute policy effects to decrease the LFPR by about .9%. In contrast, the baby boomer effect will contribute to about a 3% decline over the same time frame.
http://www.cbo.gov/sites/default/fi...20xx/doc12052/03-22-laborforceprojections.pdf
The Boston Fed paper also concludes something different from the WaPo article, and which the WaPo article doesn't tell us. From the WaPo article:
But the economic story is also bleak in places, particularly for older workers: Another recent paper noted that the decline in U.S. manufacturing jobs may be partly responsible for the fall in the participation rate. During the housing boom in the 2000s, many of those manufacturing workers could find jobs in the construction sector. But once housing went bust, they were left adrift, unable to find new work.
But the Boston Fed data says that the story for older adults is about what it was before the crisis,
"As shown above in Table 1, the LFPR for adults 55 to 64 years old has risen only modestly since 2007-a full percentage point lower in 2012 than the BLS had projected as of November 2007...By contrast, the LFPR for adults aged 65 years and older has risen notably over the past few years to a level in 2012.....In effect, the average LFPR for all adults 55 years and above remains roughly in line with its pre-crisis trend," (pp 17-18).
Also note that when the WaPo is showing a graph about forecasted unemployment and labor participation rates from the BLS, we must account for the variation in the forecast, ie forecast error - which the WaPo doesn't mention. The Boston Fed paper makes the same point I'm making here:
"Of course, even demographic patterns are not perfectly predictable. Table 1 shows that
the actual 5-year changes in the population shares for several broad age groups have turned out to be noticeably different from what was projected in 2007; i.e., the share of prime-age adults is a full percentage point lower than expected, while the shares for youths and for 55-to-64-year-olds are correspondingly higher" (p11)
We have to consider forecast error from the BLS before we can say if there is something indicated by the data that happened to significantly throw off their forecasts. So the WaPo just throwing up a graph of a forecasted variable and the actual variable doesn't tell us what we need. Usually economic forecasts become pretty wild and variable after you go out more than a couple of quarters. I don't know what the BLS forecast errors are currently for the LFPR (and I don't think the Boston Fed writer did either), but previous estimated errors for long periods of time have varied between –8.3% and +8.3% (
http://www.stats.bls.gov/opub/mlr/2005/07/art5full.pdf, table 2). So this would at least suggest just a little bit of caution when thinking that any deviation from BLS forecasts is automatically noteworthy. It may also suggest that forecasting is useless over long periods of time. In any case, if we use previous forecast errors, or if we just say we don't know the forecast errors, then we cannot conclude as the WaPo does that " the number of Americans working or actively seeking work has actually fallen faster than demographers had predicted." Since it's within previous forecast errors for long periods of time, then it hasn't fallen more than predicted. If we don't know the forecast error, then we don't know if it's fallen more than predicted.