Climate Researcher Blows Whistle: CLIMATE CHANGE IS A FRAUD

Lastamender

Diamond Member
Joined
Dec 28, 2011
Messages
65,087
Reaction score
59,277
Points
3,600
A lot of this going on. Why is it ignored by the MSM. These are scientists too. People need to hear this.

Renowned scientist Dr. Ned Nikolov has had over 20 years of experience in the scientific field, he carries an impressive resume and he comes with one message: Climate Change is overblown!

 
Climate change is not a fraud, it is a science.

"Global Warming" aka Co2 based climate change is a complete and total fraud.

It started with NO EVIDENCE to support it, and responded by FUDGING the data...


satellite and weather balloon data have actually suggested the opposite, that the atmosphere was cooling


Theory = increasing atmospheric Co2 would warm the atmosphere

DATA = nope

Science = THEORY REJECTED


Nikolov and his colleague Karl Zeller, who used to work together at the forest service, were the subject of controversy when they were caught trying to published a paper under pseudonyms Den Volokin and Lark ReLlez multiple times from 2014 to 2016.7
Naughty boys!
 
A lot of this going on. Why is it ignored by the MSM. These are scientists too. People need to hear this.

Renowned scientist Dr. Ned Nikolov has had over 20 years of experience in the scientific field, he carries an impressive resume and he comes with one message: Climate Change is overblown!


Your CAPS title uses the word "fraud". Your text subs in "overblown". The two terms are not synonymous.

LibertySentinel.org on Mike Lindell's FrankSpeech.com? Is THAT where you go for good science?

The scientist first speaks 40:55 into the video, so use your fast forward unless you'd like to sample the quality of this particular podcaster.

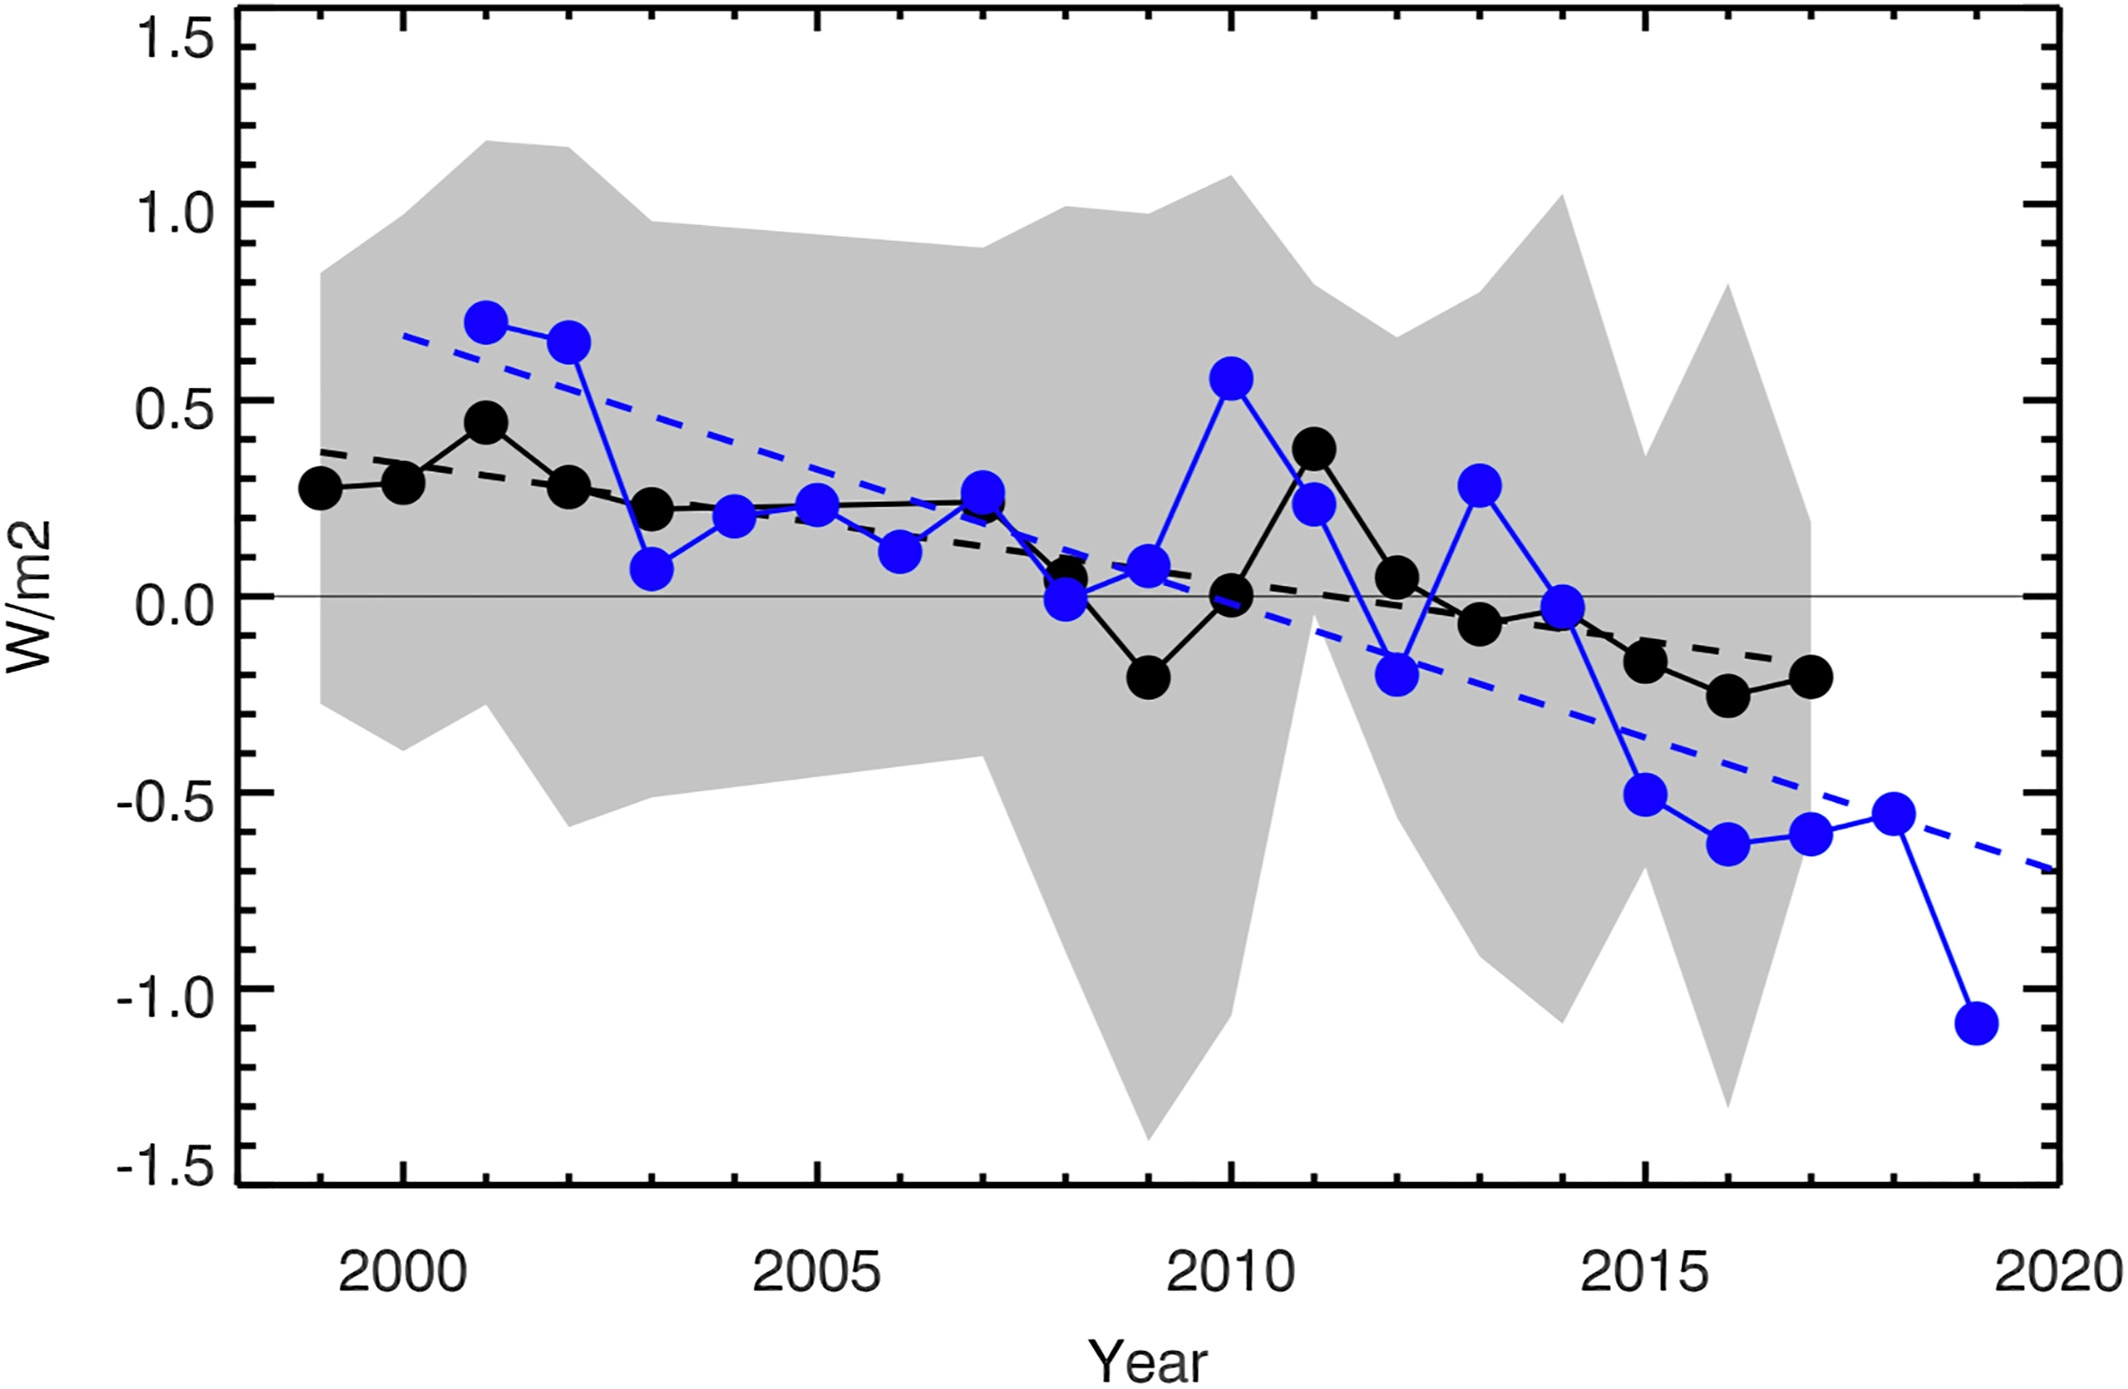
Here is Figure 7.3 of WGI, AR6, which Nikolov claims is inverted.

1724810391930.png


Dr. Nikolov is contending that the data in the first and third of these three graphs is "inverted". Those data, from the CERES satellite and publicly available, show visible light reflected from the Earth. If the reflected portion increases, the amount absorbed decreases and vice versa. You should take note of the sentence in the fourth line of the caption which reads "All flux anomalies are defined as positive downwards, consistent with the sign convention used throught this chapter".

Dr Nikolov states that the text in WGI makes no reference to that CERES data, but that is incorrect. Directly above the graphic in paragraph 7.2.2.1 may be found the comments:

For example, globally, the reduction in both outgoing thermal and reflected solar radiation during La Niña conditions in 2008/2009 led to an energy gain for the climate system, whereas enhanced outgoing thermal and reflected solar radiation caused an energy loss during the El Niños of 2002/2003 and 2009/2010 (Figure 7.3; Loeb et al., 2018b).
and
Under cloud-free conditions, the CERES record shows a near zero trend in outgoing thermal radiation (Loeb et al., 2018b), which – combined with an increasing surface upwelling thermal flux – implies an increasing clear-sky greenhouse effect (Raghuraman et al., 2019). Conversely, clear-sky solar reflected TOA radiation in the CERES record covering March 2000 to September 2017 shows a decrease due to reductions in aerosol optical depth in the Northern Hemisphere and sea ice fraction (Loeb et al., 2018a; Paulot et al., 2018).


This text states that the trend of the top graph - global mean solar flux anomaly - is trending negative during the 2008-2009 period and trending positive during 2002/2003 and 2009/2010. An examination of the graph shows data trending upwards in the first period and downwards in the second two. I believe the graph has INTENTIONALLY been inverted - as stated - simply to concur with the sign convention used in the rest of the chapter. I believe Dr Nikolov missed the comment highlighted above in purple. The text of the WGI report matches the observations in several studies of these precise data and DR Nikolov's data showing a decrease in reflected sunlight over time. The graph has simply adopted an unusual format.

FOR EXAMPLE


1724811494568.png

and

And the conclusions of this paper by Goode et al

4 Conclusions

We have reported a two-decade long data set of the Earth's nearly globally averaged albedo as derived from earthshine observations. Stringent data quality standards were applied to generate monthly and annual means. These vary significantly on monthly, annual, and decadal scales with the net being a gradual decline over the two decades, which accelerated in the most recent years. Remarkably, the inter-annual earthshine anomalies agree well with those from CERES satellite observations, despite their differences in global coverage, underlying assumptions to derive the albedo, and the very different sensitivities to retroflected and wider-angle reflected light.
The two-decade decrease in earthshine-derived albedo corresponds to an increase in radiative forcing of about 0.5
urn:x-wiley:00948276:media:grl62955:grl62955-math-0063
, which is climatologically significant (Miller et al., 2014). For comparison, total anthropogenic forcing increased by about 0.6
urn:x-wiley:00948276:media:grl62955:grl62955-math-0064
over the same period. The CERES data show an even stronger trend of decreasing global albedo over the most recent years, which has been associated to changes in the PDO, SSTs and low cloud formation changes. It is unclear whether these changes arise from the climate's internal variability or are part of the feedback to external forcings.
As earthshine-derived global albedos are quite insensitive to long-term calibration issues (they are relative measurements), we hope that our results will encourage a resumption and revitalization of earthshine observations with new automated telescopes, DSCOVR-type observations, cubesat missions, or even a lunar observatory.
 
Last edited:
Your CAPS title uses the word "fraud". Your text subs in "overblown". The two terms are not synonymous.

LibertySentinel.org on Mike Lindell's FrankSpeech.com? Is THAT where you go for good science?

The scientist first speaks 40:55 into the video, so use your fast forward unless you'd like to sample the quality of this particular podcaster.

Here is Figure 7.3 of WGI, AR6, which Nikolov claims is inverted.

View attachment 1002551

Dr. Nikolov is contending that the data in the first and third of these three graphs is "inverted". Those data, from the CERES satellite and publicly available, show visible light reflected from the Earth. If the reflected portion increases, the amount absorbed decreases and vice versa. You should take note of the sentence in the fourth line of the caption which reads "All flux anomalies are defined as positive downwards, consistent with the sign convention used throught this chapter".

Dr Nikolov states that the text in WGI makes no reference to that CERES data, but that is incorrect. Directly above the graphic in paragraph 7.2.2.1 may be found the comments:

For example, globally, the reduction in both outgoing thermal and reflected solar radiation during La Niña conditions in 2008/2009 led to an energy gain for the climate system, whereas enhanced outgoing thermal and reflected solar radiation caused an energy loss during the El Niños of 2002/2003 and 2009/2010 (Figure 7.3; Loeb et al., 2018b).
and
Under cloud-free conditions, the CERES record shows a near zero trend in outgoing thermal radiation (Loeb et al., 2018b), which – combined with an increasing surface upwelling thermal flux – implies an increasing clear-sky greenhouse effect (Raghuraman et al., 2019). Conversely, clear-sky solar reflected TOA radiation in the CERES record covering March 2000 to September 2017 shows a decrease due to reductions in aerosol optical depth in the Northern Hemisphere and sea ice fraction (Loeb et al., 2018a; Paulot et al., 2018).


This text states that the trend of the top graph - global mean solar flux anomaly - is trending negative during the 2008-2009 period and trending positive during 2002/2003 and 2009/2010. An examination of the graph shows data trending upwards in the first period and downwards in the second two. I believe the graph has INTENTIONALLY been inverted - as stated - simply to concur with the sign convention used in the rest of the chapter. I believe Dr Nikolov missed the comment highlighted above in purple. The text of the WGI report matches the observations in several studies of these precise data and DR Nikolov's data showing a decrease in reflected sunlight over time. The graph has simply adopted an unusual format.

FOR EXAMPLE


View attachment 1002571
and

And the conclusions of this paper by Goode et al

4 Conclusions

We have reported a two-decade long data set of the Earth's nearly globally averaged albedo as derived from earthshine observations. Stringent data quality standards were applied to generate monthly and annual means. These vary significantly on monthly, annual, and decadal scales with the net being a gradual decline over the two decades, which accelerated in the most recent years. Remarkably, the inter-annual earthshine anomalies agree well with those from CERES satellite observations, despite their differences in global coverage, underlying assumptions to derive the albedo, and the very different sensitivities to retroflected and wider-angle reflected light.
The two-decade decrease in earthshine-derived albedo corresponds to an increase in radiative forcing of about 0.5
urn:x-wiley:00948276:media:grl62955:grl62955-math-0063
, which is climatologically significant (Miller et al., 2014). For comparison, total anthropogenic forcing increased by about 0.6
urn:x-wiley:00948276:media:grl62955:grl62955-math-0064
over the same period. The CERES data show an even stronger trend of decreasing global albedo over the most recent years, which has been associated to changes in the PDO, SSTs and low cloud formation changes. It is unclear whether these changes arise from the climate's internal variability or are part of the feedback to external forcings.
As earthshine-derived global albedos are quite insensitive to long-term calibration issues (they are relative measurements), we hope that our results will encourage a resumption and revitalization of earthshine observations with new automated telescopes, DSCOVR-type observations, cubesat missions, or even a lunar observatory.
It is a hoax. To many experts with enough class not to lie for money have come out.
 
It is a hoax. To[sic] many experts with enough class not to lie for money have come out.
Was this your first? Ned Nikolov, doctor of forestry science? The fellow who missed the note in the caption explaining what he was looking at? I'm not impressed.

What you need is testimony from actual global warming experts testifying that they were approached by other scientists and offered money to lie about their work. THAT is what you whackjobs have been claiming for years now and, so far, not a single scientist, Ned Nikolov included, has said one word that could support such a charge.
 
from actual global warming experts


LOL!!!

Since Co2 does nothing and is not the cause of Earth climate change, the so-called "global warming experts" are all 100% WRONG, which is why nobody should listen to them or pay them. Instead, we should PROSECUTE THEM and THEY WOULD HAVE BEEN PROSECUTED if homO had not hid the FBI FRAUD case in the CLOSET...


Get off the internet and seek psychiatric help as quickly as you can. You really, really, really need help.
 
Was this your first? Ned Nikolov, doctor of forestry science? The fellow who missed the note in the caption explaining what he was looking at? I'm not impressed.

What you need is testimony from actual global warming experts testifying that they were approached by other scientists and offered money to lie about their work. THAT is what you whackjobs have been claiming for years now and, so far, not a single scientist, Ned Nikolov included, has said one word that could support such a charge.
Your actual experts are paid through the nose to manipulate numbers and facts. They are dishonest.
 
It's fraudulent to ignore the planet's current landmass distribution and the ocean's role in climate change.
 
You have no evidence either. That is what this thread is about.
www.ipcc.ch
I kinda figured you wouldn't understand what I was saying back in post #6. Your expert was simply wrong. The IPCC didn't get that plot upside down. It was plotted that way on purpose. Their numbers are correct. Their comments and analysis match everyone else's comments and analysis of the exact same data.
 
just show us a side by side lab experiment controlling for CO2


Black holes, si; global warming, no because it’s far more complicated to control CO2 than to simulate a black hole.

Science!

We don’t need no stinking experiments, we have consensus!
 

New Topics

Back
Top Bottom