Odd that the lefties around here have no comment. But then a little thing like facts and data
don't mean anything unless it supports their ideology. Consider this:
snippet:
New Congressional Budget Office (CBO) figures show that the top 1% paid 21.3% of all federal taxes from 1993 to 2000, when Clinton was president, but they paid 25.1% from 2003 to 2008, after the Bush tax cuts. If 21.3% was a fair share in the Clinton years, then the top 1% has been paying much more than its fair share since 2003.
.
.
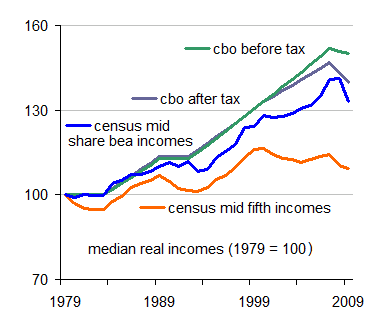
Similarly, the CBO finds that after-tax median household income rose by 48.8 percent from 1980 to 2009, after properly adjusting for shrinking household size (more singles, fewer children). The table below, constructed from CBO data, shows what happened when.
Changes in Real Median Household Income
Adjusted for Household Size
Before taxes After taxes
1979-1983 0 0
1983-1989 13.5 12.8
1989-1992 0 0
1992-2000 17.3 18.1
2000-2007 10.3 13.9
2007-2009 -4.7 -1.2
In the CBO’s after-tax estimates, real median income rose 18.1% from 1992 to 2000 (thanks to the Internet and cellphone revolutions), but median income also grew by another 13.9 percent from 2000 to 2007. Comparing pretax and after-tax estimates shows the Bush tax cuts and refundable credits helped quite a lot, particularly in the crash from 2007 to 2009.
The CBO’s Gini coefficient (a broad measure of inequality) was 0.426 in 2009 – essentially unchanged from 0.424 in 1988. Like the strong 1992-2007 increase in real median income, the absence of any sustained upward trend in such broad measures of inequality is unlikely to be treated as newsworthy during an election year.
In late 2011, by contrast, the CBO grabbed a lot of media attention with a supposedly new report saying, “The share of income received by the top 1% grew . . . to over 17% in 2007.” In a Wall Street Journal article last December, I asked why the report stopped with the frothy cyclical peak of 2007, since I could easily calculate from IRS data that “the share of after-tax income of the top 1% by my estimate fell to 11.3% in 2009.” Now that the CBO has finally gotten around to releasing estimates for 2008 and 2009, it turns out that my estimate was almost exactly on the mark: the top 1 percent’s share of after-tax income fell to 11.5% in 2009.
The CBO on Falling Incomes and Rising Tax Shares of the Top 1% | Cato @ Liberty