skookerasbil
Platinum Member
The evidence is very clear for anybody who wants to be honest and truthful. Nobody knows if it's warming and nobody knows if it's cooling. There is far too little definitive evidence either way...duh
Follow along with the video below to see how to install our site as a web app on your home screen.
Note: This feature may not be available in some browsers.
you are exactly right sir. It is establish record that the ipcc in its early 1990s reports, stated that future predictions on the climate could not be at all reliable. As the 90s moved on they suddenly dropped this statement from their reports. The climate k00ks conveniently ignore that fact all of the timeThis is very good news because it's a meeting of the minds, that we're all getting bored w/ this silly climate change discourse. Let's also forget any talk about climate change taxes--- now let's all get back to work.... it's bores me what you're doing.
I didn't say that, he did who keeps avoiding the topic and the failures of the IPCC prediction on temperature trends into the future.
Thanks so much for sharing! Apparently Spencer got the numbers from Michigan State University. MSU/AMSU Atmospheric Temperature Climate Data Record, Remote Sensing Systems (RSS) | NCAR - Climate Data Guide explains some of the limitations of the data--
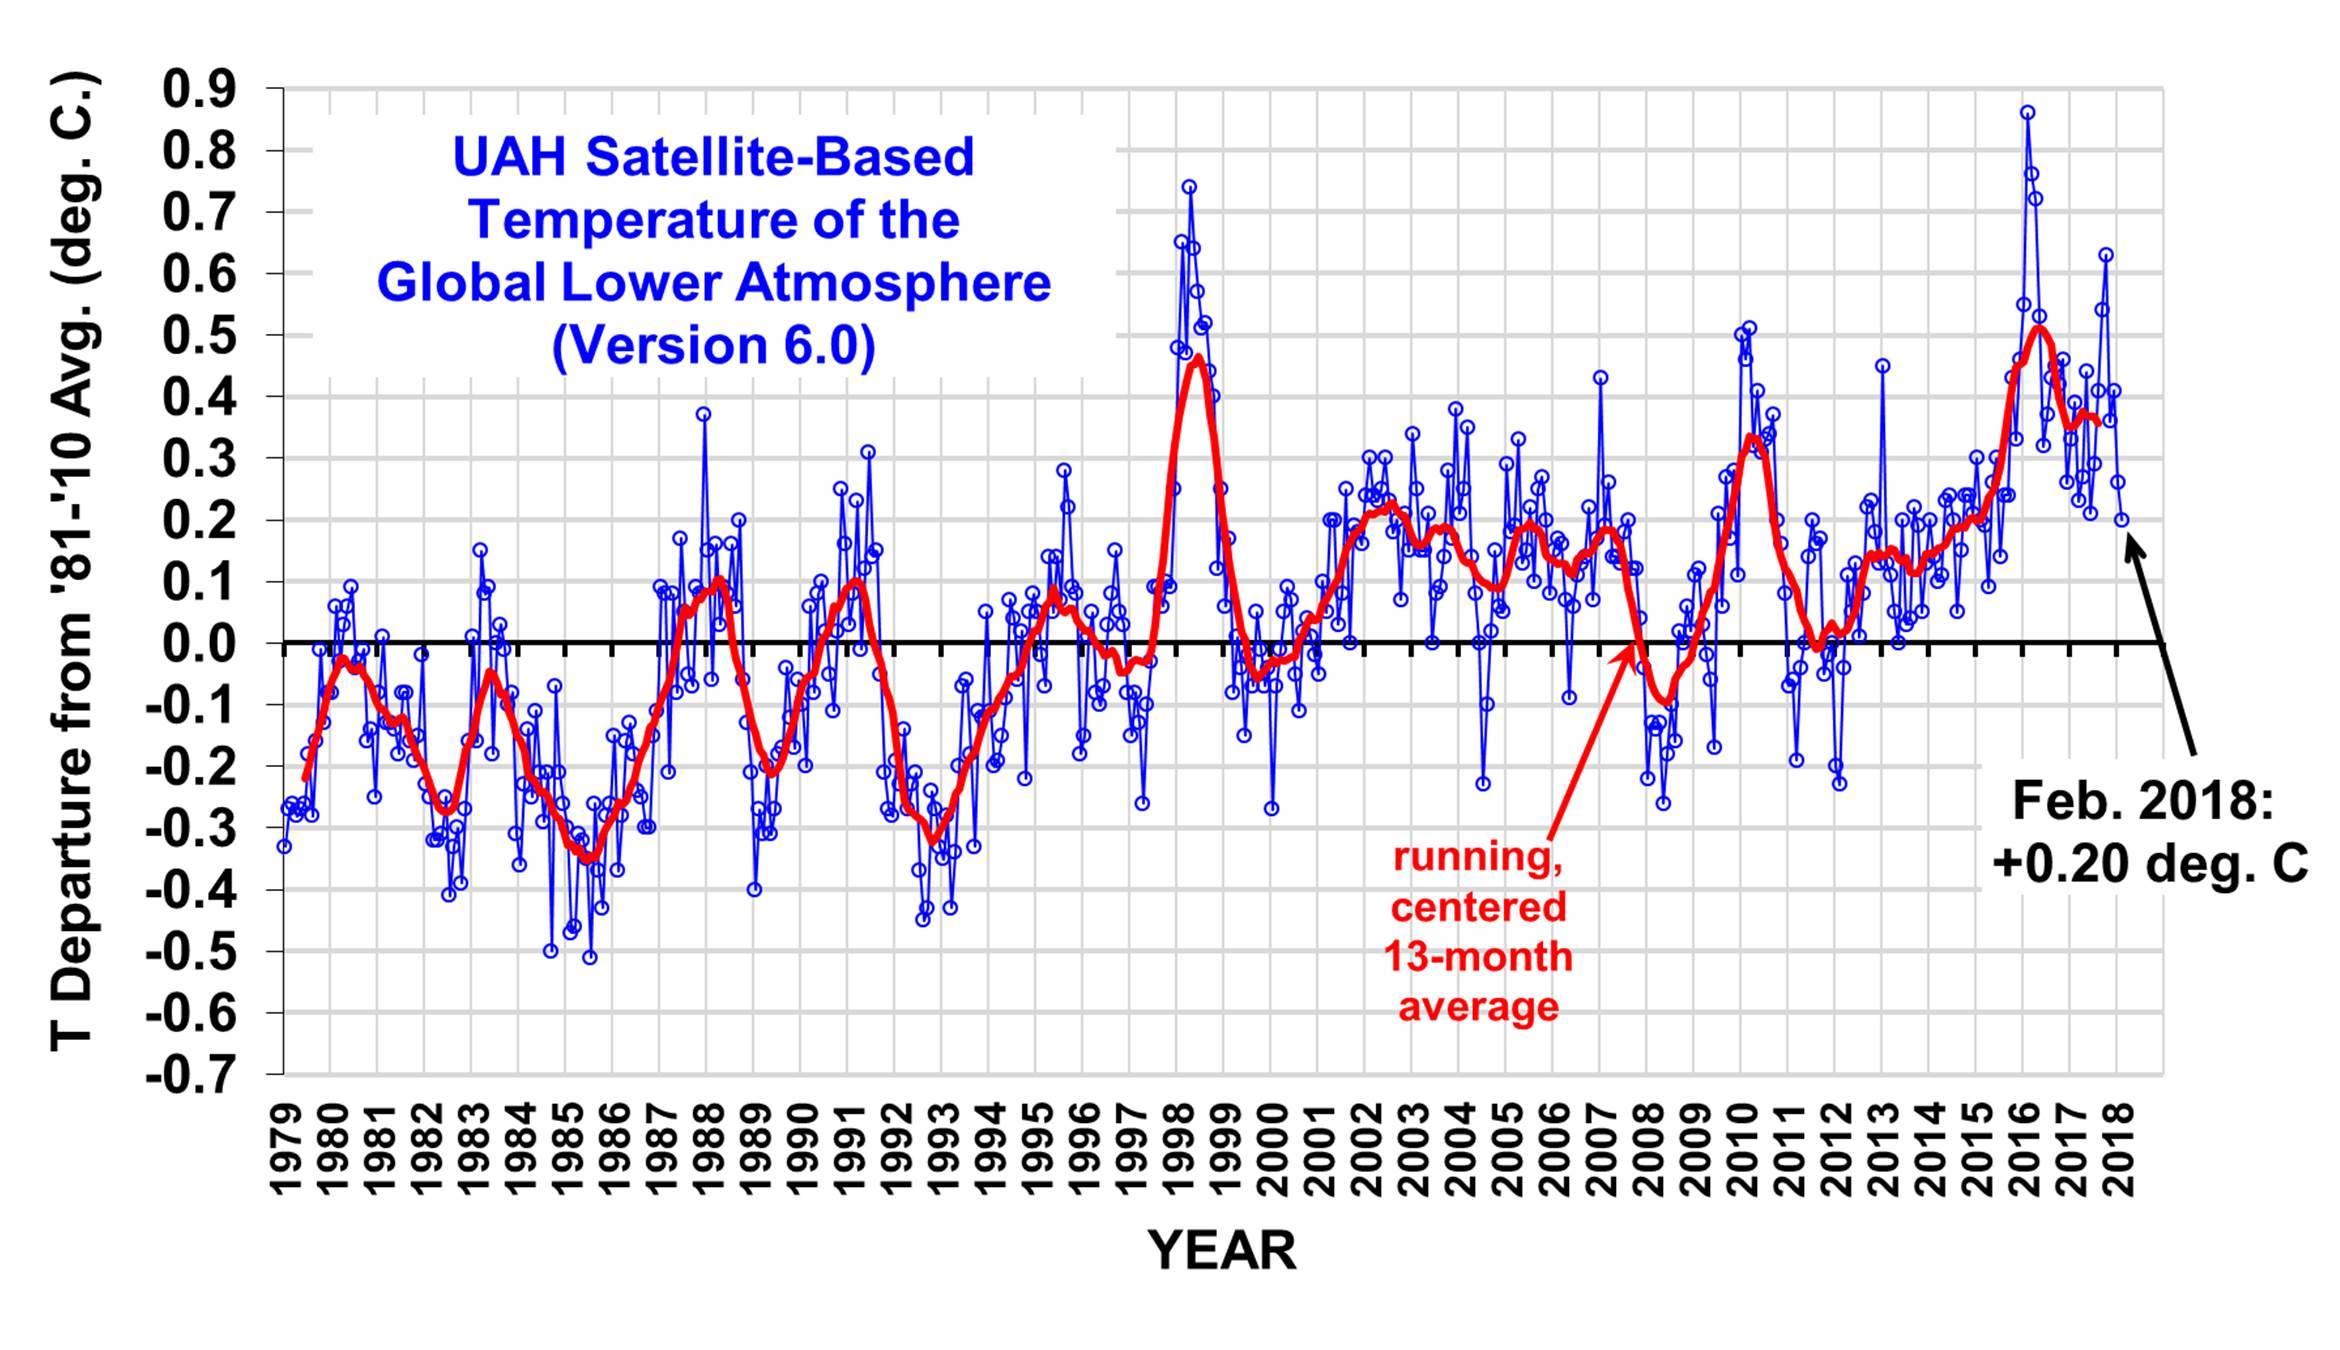
http://www.drroyspencer.com/wp-content/uploads/UAH_LT_1979_thru_February_2018_v6.jpg
From a low of -0.5 in 1984 to a high of almost 0.9 in 2016, that is 1.4 degrees in 32 years. Now that is a bit over 0.4 per decade. See how easy it is to cherry pick? Or we could go low average to high average for about 0.9 in just over three decades, just under 0.3 per decade. However you wish to state it, it has gotten warmer, glaciers worldwide are in retreat, the continental ice caps are losing ice, and we are seeing more extreme weather events every decade. Observations, not computer models.
very astute post. Always wondered why the climate alarmists in here keep coming back after repeatedly taking direct groin kicks. It's fascinatingThanks so much for sharing! Apparently Spencer got the numbers from Michigan State University. MSU/AMSU Atmospheric Temperature Climate Data Record, Remote Sensing Systems (RSS) | NCAR - Climate Data Guide explains some of the limitations of the data--
http://www.drroyspencer.com/wp-content/uploads/UAH_LT_1979_thru_February_2018_v6.jpg
From a low of -0.5 in 1984 to a high of almost 0.9 in 2016, that is 1.4 degrees in 32 years. Now that is a bit over 0.4 per decade. See how easy it is to cherry pick? Or we could go low average to high average for about 0.9 in just over three decades, just under 0.3 per decade. However you wish to state it, it has gotten warmer, glaciers worldwide are in retreat, the continental ice caps are losing ice, and we are seeing more extreme weather events every decade. Observations, not computer models.
--and it's amazing that virtually all climate data reports bear similar caveats. Translation: nobody knows what the average temperature of the earth's surface is, much less what it's been over say, the past 50,000 years.
- Long-term trends depend on adjustments for changing local measurement times; errors in these adjustments could lead to long-term uncertainty
- Not useful for absolute temperature measurements


From post 43 is this howler since the charts starts at 1979:
"From a low of -0.5 in 1984 to a high of almost 0.9 in 2016, that is 1.4 degrees in 32 years. Now that is a bit over 0.4 per decade. See how easy it is to cherry pick? Or we could go low average to high average for about 0.9 in just over three decades, just under 0.3 per decade. However you wish to state it, it has gotten warmer, glaciers worldwide are in retreat, the continental ice caps are losing ice, and we are seeing more extreme weather events every decade. Observations, not computer models."
You first made a bogus dishonest argument, by not starting from 1979, which would completely destroy your dumb cherrypick argument. Since you made one, you actually seem to say lets cherrypick something.
What the charts really says that it warmed about .50C total as of February 2018, far less than .20C warming per decade. Which smashes the IPCC per decade warming Prediction/Projection of .30C per decade warming rate.
You actually hurt your own cause here.
Thank you.
Let me help a bit....
View attachment 186219
My point is simply that in 1871 we started a cooling phase and that we cyclically go from cooling to warming.. Rates of warming are consistent with past rates and no acceleration is present. Natural variation is the cause not man.From post 43 is this howler since the charts starts at 1979:
"From a low of -0.5 in 1984 to a high of almost 0.9 in 2016, that is 1.4 degrees in 32 years. Now that is a bit over 0.4 per decade. See how easy it is to cherry pick? Or we could go low average to high average for about 0.9 in just over three decades, just under 0.3 per decade. However you wish to state it, it has gotten warmer, glaciers worldwide are in retreat, the continental ice caps are losing ice, and we are seeing more extreme weather events every decade. Observations, not computer models."
You first made a bogus dishonest argument, by not starting from 1979, which would completely destroy your dumb cherrypick argument. Since you made one, you actually seem to say lets cherrypick something.
What the charts really says that it warmed about .50C total as of February 2018, far less than .20C warming per decade. Which smashes the IPCC per decade warming Prediction/Projection of .30C per decade warming rate.
You actually hurt your own cause here.
Thank you.
Let me help a bit....
View attachment 186219
Not sure what you are trying here, but your chart show three similar warming trends from the mid 1800's. DR. Jones
The IPCC started their per decade warming prediction/projections with their first 1990 IPCC report, which stated that it was PREDICTED to warm on average of .30C per Decade and be 1C warmer by 2025.
Yo Ho Billy Bob!!! How have you been?My point is simply that in 1871 we started a cooling phase and that we cyclically go from cooling to warming.. Rates of warming are consistent with past rates and no acceleration is present. Natural variation is the cause not man.
That data includes the effects from urbanization.Yo Ho Billy Bob!!! How have you been?
So, we've been cooling since 1871? That doesn't seem quite right. If we're cooling, why does the data look like this:
View attachment 536386
and this
View attachment 536387
and this
View attachment 536389
and this
View attachment 536388
Eh?
We have mixed politics with science once again and the result is junk science.By Dale Leuck March 17, 2018Data available in both text and csv formats at the NASA, GISS website have been routinely cited as indicative of global warming despite their known weaknesses. The three years 2015 through 2017 are widely reported as the three hottest years on record.Tony Heller, however, has demonstrated that tampering with data from the U.S. Climatology Network (USHCN) has created the illusion of much higher temperatures in reported data than in the original data, for the continental United States. This leads one to wonder how much not so widely known "adjustments" in GISS data have been responsible for similar results at a global level.The GISS data are updated around the middle of each month, and I have compared the January and March versions in figure 1, for the years 1881 through 2017. The data are smoothed over two years, in that, for example, the 1881 data point is the average of 1880 and 1881 and 2017 the average for 2016 and 2017. This is commonly done to make data more presentable, allowing movements to be more clearly discerned and to smooth out the effects of "abnormal" years......any data set from only 1880, and inadequately covering the earth's surface area, does not provide a definitive answer to the question of "global warming" in terms of geological time of thousands of years, and representing the entirety of the Earth. But, as it has been the data set often referenced to substantiate global warming, one would have thought the substantially lower temperatures of the last many months would have merited highlighting in the mainstream media.
Read more: Are we undergoing global cooling?
The data definitely show global cooling in a form I did see mentioned in the article. Instead of seeing new annual temperatures reaching new lows what we really have are past recorded temperatures plummeting year after year [from the article:

This has been also happening for temperatures farther back in history which also have been falling at an ever increasing rate:
Ministry Of Truth – Erasing The Medieval Warm Period. | The Deplorable Climate Science Blog

The "loss" of the Midieval Warm Period has deeply concerned my the way that many in the scientific community have prostituted themselves for grant money. My thinking is that there will be a day of reconing and my only hope is that it's one of understanding of the limits of human's ability to remain 'scientific' in a political world.By Dale Leuck March 17, 2018Data available in both text and csv formats at the NASA, GISS website have been routinely cited as indicative of global warming despite their known weaknesses. The three years 2015 through 2017 are widely reported as the three hottest years on record.Tony Heller, however, has demonstrated that tampering with data from the U.S. Climatology Network (USHCN) has created the illusion of much higher temperatures in reported data than in the original data, for the continental United States. This leads one to wonder how much not so widely known "adjustments" in GISS data have been responsible for similar results at a global level.The GISS data are updated around the middle of each month, and I have compared the January and March versions in figure 1, for the years 1881 through 2017. The data are smoothed over two years, in that, for example, the 1881 data point is the average of 1880 and 1881 and 2017 the average for 2016 and 2017. This is commonly done to make data more presentable, allowing movements to be more clearly discerned and to smooth out the effects of "abnormal" years......any data set from only 1880, and inadequately covering the earth's surface area, does not provide a definitive answer to the question of "global warming" in terms of geological time of thousands of years, and representing the entirety of the Earth. But, as it has been the data set often referenced to substantiate global warming, one would have thought the substantially lower temperatures of the last many months would have merited highlighting in the mainstream media.
Read more: Are we undergoing global cooling?
The data definitely show global cooling in a form I did see mentioned in the article. Instead of seeing new annual temperatures reaching new lows what we really have are past recorded temperatures plummeting year after year [from the article:
This has been also happening for temperatures farther back in history which also have been falling at an ever increasing rate:
Ministry Of Truth – Erasing The Medieval Warm Period. | The Deplorable Climate Science Blog