AGW Cult Explains it all

Tell me why UAH made adjustments to be more like RSS? was it becasue they found errors? And RSS has been consistently lower than the HCN system.. Is that your beef? Because the corrections did not meet you expectations of warming?
Yeah UAH found errors in RSS, but that RSS had spurious cooling giving a false lowering of the temperature data. So Spencer created a whole new computer model, v6.0, to fabricate even colder fudged data than RSS.

In the past, when the satellite data differed from the ground station data, it was the ground station data that was proven to be accurate and the satellite data proven to be flawed.

"my UAH cohort and boss John Christy, who does the detailed matching between satellites, is pretty convinced that the RSS data is undergoing spurious cooling because RSS is still using the old NOAA-15 satellite which has a decaying orbit, to which they are then applying a diurnal cycle drift correction based upon a climate model, which does not quite match reality. We have not used NOAA-15 for trend information in years…we use the NASA Aqua AMSU, since that satellite carries extra fuel to maintain a precise orbit."
-Roy Spencer
 
The satellite data shows the HCN data not only corrupt but flat ass made up bull shit
Now that is flat out made up bullshit.
Ground station data has been historically proven to be more accurate than the satellite data.
 
Tell me hairball, how do you magically make a +/-1 deg C error bar less than 0.01 Deg C?

By averaging more than 10,000 measurements. Anyone who didn't flunk statistics 101 would have known that. Again, every denier here is profoundly stupid when it comes to basic statistics.

Now, most people don't know the statistics either, but that doesn't make them stupid. There are plenty of topics that I don't know about, but it doesn't make me stupid. Nobody can know everything. However, if I started screaming that, say, something about dark matter theory meant there had to be a global plot by astrophysicists, that would make me stupid. To be stupid, you have to proudly announce that the only possible explanation for your own lack of understanding is a global conspiracy directed at you, which is what all the deniers do. If you're going to set yourself forth as a world expert in a topic, you better actually know at least the basics of the topic you're raging about, and you look like a moron if you don't.

And yes, I did notice that none of the deniers could solve my very simple statistics problem.
You really are a moron... A clueless moron...

Error bars are the size of the worst piece of equipment you use. Anyone with basic knowledge of statistics and science would know that...
 
Error bars are the size of the worst piece of equipment you use. Anyone with basic knowledge of statistics and science would know that...

It is comments like these that demonstrate quite conclusively that you have no form of science education at all.
 
Error bars are the size of the worst piece of equipment you use. Anyone with basic knowledge of statistics and science would know that...

Damn, you're stupid. Any Statistics 101 textbook will say the same thing, but I'll use Wiki for convenience.

Standard error - Wikipedia, the free encyclopedia
---
SEM is usually estimated by the sample estimate of the population standard deviation (sample standard deviation) divided by the square root of the sample size (assuming statistical independence of the values in the sample):
bb234d9a63401082dbd197c430fd35c9.png

where
s is the sample standard deviation (i.e., the sample-based estimate of the standard deviation of the population), and
n is the size (number of observations) of the sample.
---

That is, the more measurements you use in the average, the less the error of the average is. The error goes down proportionally to the square root of the number of measurements. If you average 10,000 measurements, the error of the average is 100 times less than the error of each individual measurement.

That's why measurements of average temperature from long ago can have such small errors. Most of the deniers here, including the ones claiming a science background, are shockingly clueless about such basic statistics. They'd literally fail a Statistics 101 class, which is how we know they're frauds, as nobody who really has a science background would make such a bonehead error. And it won't matter that I just took the time to explain it to them, again. They'll just add statistics to their list of "Basic math and science which has been known for centuries which is really totally wrong, because the cult says so."
 
Fk an a, a fkn thermometer. hmmmmm how can that be? the numbers are just anomalies right, they pull fkn numbers out of the sky according to your dumb ass.
Hey dumb ass, of course they use thermometers to measure anomalies, and nowhere did I say otherwise! You are just further proving your STUPIDITY. I said they do not use the RAW TEMPERATURES measured by the thermometers, but use an AVERAGE of the raw temperatures over 30 years to calculate the anomaly which accurately shows the temperature TREND independent of any calibration of the thermometers.

I can't thank you enough!!!
:rofl::lmao:

From the CRU site:
”Stations on land are at different elevations, and different countries estimate average monthly temperatures using different methods and formulae. To avoid biases that could result from these problems, monthly average temperatures are reduced to anomalies from the period with best coverage (1961-90)….” In other words although measuring an average temperature is “biased”, measuring an average anomaly (deltaT) is not. Each monthly station anomaly is actually the difference between the measured monthly temperature and so-called “normal” monthly values. In the case of Hadley Cru the normal values are the 12 monthly averages from 1961 to 1990.
nice flip

BTW, what is a formulae?
No flip, just your consistent stupidity, see the earlier post below.

And "formulae" is the plural of "formula."

Not when using anomalies, which is why scientists are smart enough to use them.

Anomalies use the 30 year average of that thermometer to measure the DEVIATION from that average. So the accuracy of the individual thermometer has no effect on the deviation from the thermometer's average.
well how do they know the anomaly if they don't look at the thermometer, isn't that what I asked? and you stated:
how do you figure? If the thermometer is one degree different and that is one degree change is used, what's the difference? Isn't it the same degree up or down?
Not when using anomalies, which is why scientists are smart enough to use them.

Anomalies use the 30 year average of that thermometer to measure the DEVIATION from that average. So the accuracy of the individual thermometer has no effect on the deviation from the thermometer's average.
they need the thermometer dufass to add the change to the average. What a stupid tool you are.

And BTW, everyday there is a new average. Every flippin day.
Again, proof of the utter and complete stupidity of deniers.
Thank you.

So what is it, do they use thermometers or not? How is it they know the change if they don't use a thermometer? I mean, your flip was mar....velous
You conveniently left out Billy Bob's post about the error range of the thermometers, which is why I pointed out that using anomalies solved that problem.

Again, at no time, except in your failure to understand anomalies, did I say they did not use thermometers, only that they did not use the raw temperature.

You just keep proving your stupidity.
Thank you so much.
In 1880 the thermometers used had error ranges of about +/-2 deg C (or a 4 degreee C range) anything in that range is of no statistical value.
Which is why REAL scientists are smart enough to use ANOMALIES rather than the raw temperature.
DUH!
what advantage does using the anomalies give them that the reading off the thermometer doesn't? I bet this is interesting.
so how do they determine the change if they don't use the raw temperature? Are you saying there are anomalyometers now?
 
The poo flinging monkey is being misleading again.

What is the size of the grids being analyzed for ocean temps? What is the avg number of measurements per grid? Seasonal effects need to be removed, what is the added error there? Type of measurement, eg canvas buckets, engine intakes, insulated buckets,etc, all add more error.

The oceans are a huge expanse. Prior to the last few decades I would imagine the median amount of even monthly measurements per gridcell would be less than a handful, and the mode would be zero.
 
Hey dumb ass, of course they use thermometers to measure anomalies, and nowhere did I say otherwise! You are just further proving your STUPIDITY. I said they do not use the RAW TEMPERATURES measured by the thermometers, but use an AVERAGE of the raw temperatures over 30 years to calculate the anomaly which accurately shows the temperature TREND independent of any calibration of the thermometers.

I can't thank you enough!!!
:rofl::lmao:

From the CRU site:
”Stations on land are at different elevations, and different countries estimate average monthly temperatures using different methods and formulae. To avoid biases that could result from these problems, monthly average temperatures are reduced to anomalies from the period with best coverage (1961-90)….” In other words although measuring an average temperature is “biased”, measuring an average anomaly (deltaT) is not. Each monthly station anomaly is actually the difference between the measured monthly temperature and so-called “normal” monthly values. In the case of Hadley Cru the normal values are the 12 monthly averages from 1961 to 1990.
nice flip

BTW, what is a formulae?
No flip, just your consistent stupidity, see the earlier post below.

And "formulae" is the plural of "formula."

Not when using anomalies, which is why scientists are smart enough to use them.

Anomalies use the 30 year average of that thermometer to measure the DEVIATION from that average. So the accuracy of the individual thermometer has no effect on the deviation from the thermometer's average.
well how do they know the anomaly if they don't look at the thermometer, isn't that what I asked? and you stated:
Not when using anomalies, which is why scientists are smart enough to use them.

Anomalies use the 30 year average of that thermometer to measure the DEVIATION from that average. So the accuracy of the individual thermometer has no effect on the deviation from the thermometer's average.
they need the thermometer dufass to add the change to the average. What a stupid tool you are.

And BTW, everyday there is a new average. Every flippin day.
Again, proof of the utter and complete stupidity of deniers.
Thank you.

So what is it, do they use thermometers or not? How is it they know the change if they don't use a thermometer? I mean, your flip was mar....velous
You conveniently left out Billy Bob's post about the error range of the thermometers, which is why I pointed out that using anomalies solved that problem.

Again, at no time, except in your failure to understand anomalies, did I say they did not use thermometers, only that they did not use the raw temperature.

You just keep proving your stupidity.
Thank you so much.
In 1880 the thermometers used had error ranges of about +/-2 deg C (or a 4 degreee C range) anything in that range is of no statistical value.
Which is why REAL scientists are smart enough to use ANOMALIES rather than the raw temperature.
DUH!
what advantage does using the anomalies give them that the reading off the thermometer doesn't? I bet this is interesting.
so how do they determine the change if they don't use the raw temperature? Are you saying there are anomalyometers now?
The perpetual dumb act!

As was already explained to you, the anomaly is the deviation from a 30 year temperature average. The raw temperature is used to calculate the 30 year average only. So even is the thermometer was say 5 degrees off, the anomaly will accurately show if the TREND is warming or cooling even with that inaccurate thermometer as long as the same thermometer is use throughout all the measurements at that individual ground station.
 
Error bars are the size of the worst piece of equipment you use. Anyone with basic knowledge of statistics and science would know that...

Damn, you're stupid. Any Statistics 101 textbook will say the same thing, but I'll use Wiki for convenience.

Standard error - Wikipedia, the free encyclopedia
---
SEM is usually estimated by the sample estimate of the population standard deviation (sample standard deviation) divided by the square root of the sample size (assuming statistical independence of the values in the sample):
bb234d9a63401082dbd197c430fd35c9.png

where
s is the sample standard deviation (i.e., the sample-based estimate of the standard deviation of the population), and
n is the size (number of observations) of the sample.
---

That is, the more measurements you use in the average, the less the error of the average is. The error goes down proportionally to the square root of the number of measurements. If you average 10,000 measurements, the error of the average is 100 times less than the error of each individual measurement.

That's why measurements of average temperature from long ago can have such small errors. Most of the deniers here, including the ones claiming a science background, are shockingly clueless about such basic statistics. They'd literally fail a Statistics 101 class, which is how we know they're frauds, as nobody who really has a science background would make such a bonehead error. And it won't matter that I just took the time to explain it to them, again. They'll just add statistics to their list of "Basic math and science which has been known for centuries which is really totally wrong, because the cult says so."

Your conflating (mixing up) the standard deviation of an anomaly to direct measurements error bands.

In an anomaly average, you are taking 10 stations, which had 100 samples each. Each of those stations were plotted from a singular average of all the samples over a base period of time. The actual readings were then subtracted from the base average and an anomaly is derived. The anomalies are then normalized at a date within the period for comparison and averaged. From this number is derived the standard deviation of the set.


In an actual RAW data set, the error bar of the devices used for the set is what determines the error boundaries. If you have 1000 measurements from instruments which have a +/- 1 deg C error boundary the average of those measurements will have the same error bounds. You have simply condensed the set to one number within the abilities of the measuring devices. YOU HAVE NOT MADE THEM MORE ACCURATE.

IF you want to argue that more measurements will fall closer to the mean because the devices have varying errors (some positive and some negative) and will balance out is somewhat valid, but without knowing the exact error, this is nothing more than a crap shoot and your basing your science off of the laws of averages. (Even in that, the possibility you will get a batch of measuring devices which are all +1 is a 1/2 chance).

I won this argument many years ago.. Its called commonsense.
 
Your conflating (mixing up) the standard deviation of an anomaly to direct measurements error bands.

No, that has nothing to do with the basic statistics that you're failing at.

In an anomaly average, you are taking 10 stations, which had 100 samples each. Each of those stations were plotted from a singular average of all the samples over a base period of time. The actual readings were then subtracted from the base average and an anomaly is derived. The anomalies are then normalized at a date within the period for comparison and averaged. From this number is derived the standard deviation of the set.

No, that's just some weird handwaving on your part that has nothing to do with anything.

In an actual RAW data set, the error bar of the devices used for the set is what determines the error boundaries. If you have 1000 measurements from instruments which have a +/- 1 deg C error boundary the average of those measurements will have the same error bounds.

And that's still completely completely wrong. The error of an average goes down as more measurements are used in the average. Basic statistics. You can keep trying to debate it, but it's not debatable.

You have simply condensed the set to one number within the abilities of the measuring devices. YOU HAVE NOT MADE THEM MORE ACCURATE

That's nice, but nobody ever said or implied the measurements were more accurate. That's your strawman (and Frank's), and the fact that you keep using it illustrates how you don't know what you're talking about.

The individual measurements always have the same error, independent of the number of them you take.

The error of the average goes down as the number of measurements in the average goes up.

If you want to argue that more measurements will fall closer to the mean because the devices have varying errors (some positive and some negative) and will balance out is somewhat valid, but without knowing the exact error, this is nothing more than a crap shoot and your basing your science off of the laws of averages. (Even in that, the possibility you will get a batch of measuring devices which are all +1 is a 1/2 chance).

No, I won't argue that, because it's another of your irrelevant strawmen that I care nothing about.

I won this argument many years ago.. Its called commonsense.

So basic statistics as understood for centuries is all wrong ... because you say so.

Good luck with that. Make sure you write it up in a paper and present it, as there's surely another Nobel Prize in store for you.
 
The poo flinging monkey is being misleading again.

When Ian acts like this, I carve another notch. After all, if he could respond to what I actually said, he would. He can't.

What is the size of the grids being analyzed for ocean temps? What is the avg number of measurements per grid? Seasonal effects need to be removed, what is the added error there? Type of measurement, eg canvas buckets, engine intakes, insulated buckets,etc, all add more error.

A fine diversion, which has nothing to do with the point. Let me dumb it down enough so that even Ian can't pretend to not understand it.

Frank and others have been constantly babbling a stupid story. Ocean temps are presented with low error bars. They say that's impossible, so the temperatures must be faked somehow.

I pointed out that they just suck at statistics, hence their argument is dumb and reveals them to be ignorant and paranoid. If you take a zillion measurements, the error of the average has to be very small, regardless of how big it started out, and babbling about buckets does nothing to change that.


The poo flinging monkey dodges my main point. There are not a zillion measurements per grid cell, and the ones that are there are not in the same place at the same time.

Even the finest of grid cells are still at least one degree in latitude. 90 degrees from the equator to a pole. Close to a 30C spread between them. Close to a third of a degree spread just in a single cell (now, the cells used to be up to 5 degrees high). Depending on where in the cell the measurement was taken, it could easily be a tenth of a degree higher or lower than the true avg. Temps also change between seasons, or vary by prevailing wind conditions. Etc. Every adjustment adds error to the mix.

Mamooth is incorrect to claim zillions of measurements per location. Most locations have few measurements and they are separate both in time and conditions.

This is not a case where the law of large numbers apply.
 
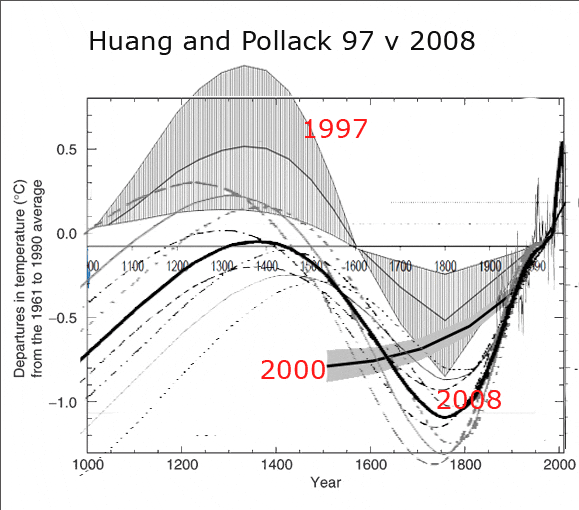
huang-pollack-97-2000-2008.gif


I put this up for crick on one of these threads. What is it saying? Three different papers, using the same pool of borehole data, by the same authors, and yet they come to three mutually exclusive conclusions. Each one with a narrow range of 'error'.

Should we believe the stated certainty claimed? For which one? All if them? I have little doubt that the error bars were computed correctly by a standard equation. Was it an appropriate choice of defining the error range? Obviously not, but it followed standard climate science protocol and passed peer review. Those papers are all 'correct', and can be fully trusted as the 'truth'.

And some people wonder why I am a sceptic.
 
BILLY_BOB SAID:
Error bars are the size of the worst piece of equipment you use. Anyone with basic knowledge of statistics and science would know that...

You should listen to your atmospheric physicist Billy Boy and understand that those error bars are from the manufacturer's claims for the least accurate of the instruments used. Silly Ian...
 
Last edited:
BILLY_BOB SAID:
Error bars are the size of the worst piece of equipment you use. Anyone with basic knowledge of statistics and science would know that...

You should listen to your atmospheric physicist Billy Boy and understand that those error bars are from the manufacturer's claims for the least accurate of the instruments used. Silly Ian...

Crick you cant seem to understand that a proxy is AN APPROXIMATION, DERIVED FROM AN EXTRAPOLATED AVERAGE. In other words an average based on incomplete data and computer generated fiction.

Ice cores are a great example. up to 50 years of data can be held in one layer of the ice (melting, water intrusion, air intrusion, etc..) all they can do is extrapolate what they think was the average for the layer. Error bars for an average and normalized sample can be reduced because they are NORMALIZED.

I am beating my head against the wall trying to teach an idiot... Its all a Scientific Wild Ass Guess anyway.. Your like Mann who throws out real proof of 22 trees showing no warming and holding onto the ONE that you think does...

And again you fail to read "departure from temperature" is a damn anomaly... Crick once again fails the graph reading quiz..
 
Last edited:
God are you stupid. These statements tell us that you don't know what the word "extrapolate" means, that you don't know what the word "proxy" means, don't know what the word "normalized" means and are unfamiliar with the various uses of error bars, In short, you're a lying, incompetent fool.
 

Forum List

Back
Top