ScienceRocks
Democrat all the way!
- Banned
- #1
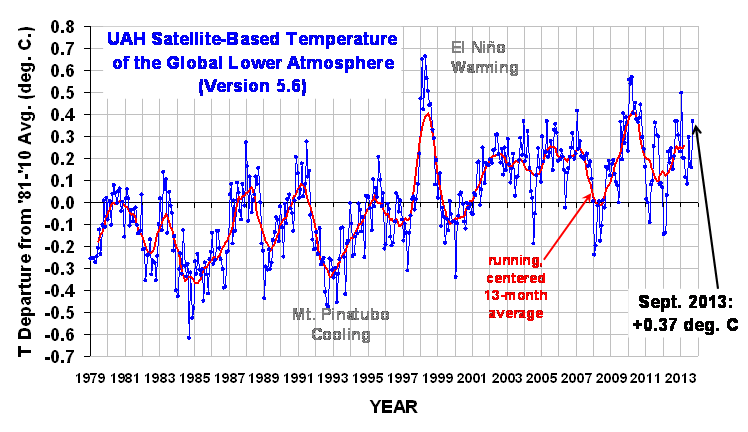
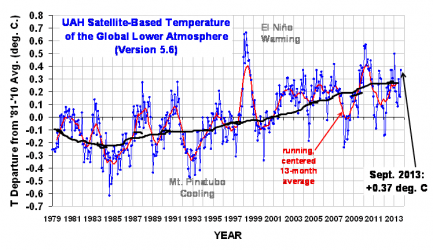
Uah sept global temp .37 http://www.nsstc.uah.edu/data/msu/t2lt/uahncdc_lt_5.6.txt
Seems to be a top 5 September globally! (4th!)
http://www.drroyspencer.com/latest-global-temperatures/
Seems to be a top 5 September globally! (4th!)
http://www.drroyspencer.com/latest-global-temperatures/