Top 1% income grew at 275% 1979-2007

...1979 as the STARTING DATE??? Because you want a MONSTROUS RATIO to rattle the class warriors...
That is an odd year. I did a little research and it seems the avg. teacher pay tripled in that same time period. I'm not that great at math, but I believe that's more than 275%...
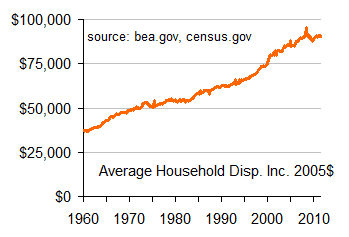
First, 1979 was in a flat period in income growth and 2007 was at a peak. Percapita income grew 73%. If they had picked 1983 to 2011 when percapita growth was 63%, the numbers for the top earners would be more up to date but the increase would have been less.
hshldinc.png

Secondly, you're absolutely right about not being good at math. A 100% increase is doubling. A 200% increase is tripling. Multiplying by 3.275 is a 275% increase.

This ABC News rant is filled with lies. The entire disparity is removed just by adjusting their numbers to include government support, and proportion for hours worked, education, years on the job, and the fact that young people start with a low income and over time work up into high incomes.
 
BTW::::

Why did this CBO pick 1979 as the STARTING DATE???

Because you want a MONSTROUS RATIO to rattle the class warriors. And 1979 would be a MINIMUM year for wealthy income coming out of the CARTER malaise...

Smell the propaganda...... :fu:

Somebody's stoking the class war fire...

That is an odd year. I did a little research and it seems the avg. teacher pay tripled in that same time period.

I'm not that great at math, but I believe that's more than 275%. :eusa_eh: I'd be curious to see other professions as well.

There was no mention of this in the numerous news reports I've seen and heard this morning. Hmmm. :confused:

And to go with your links above -- NBA pay roughly tripled in the same period..

If I had more time, I'd explore how much picking those particular years actually affected the results. But I don't really care that much about the GAP.. I care about FIXING the stagnant incomes and opportunities for the bottom half of America.

We KNOW there's a growing gap.. But it's stupid to stop at blaming the rich and not looking at all the other known variables..
 
...1979 as the STARTING DATE??? Because you want a MONSTROUS RATIO to rattle the class warriors...
That is an odd year. I did a little research and it seems the avg. teacher pay tripled in that same time period. I'm not that great at math, but I believe that's more than 275%...
First, 1979 was in a flat period in income growth and 2007 was at a peak. Percapita income grew 73%. If they had picked 1983 to 2011 when percapita growth was 63%, the numbers for the top earners would be more up to date but the increase would have been less.
hshldinc.png

Secondly, you're absolutely right about not being good at math. A 100% increase is doubling. A 200% increase is tripling. Multiplying by 3.275 is a 275% increase.

This ABC News rant is filled with lies. The entire disparity is removed just by adjusting their numbers to include government support, and proportion for hours worked, education, years on the job, and the fact that young people start with a low income and over time work up into high incomes.

It's not usually the actual numbers that confuse people (accidentally or on purpose).. For instance take the following statement..

"Your income has increased 100% over the past 10 years. Your income is now 200% of your income 10 years ago.." It depends on the grammatical phrasing of the claim..

And sometimes math challenged journalists change the grammar for effect and end up screwing the whole math relationship... The claim in the ABC article says:

The income of the richest 1 percent in the U.S. soared 275 percent from 1979 to 2007, but the bottom 20 percent grew by just 18 percent, new government data shows.

Does "soared" and "grew by" mean the same thing? I guess..
There's a great short read called "A Statistician Reads the NewsPaper" (or something close) that shows how carefully one has to parse results like this..

As for picking 1979 -- yeah it was the very end of a very flat income period. But you would PICK this end of the flat period because it gave Carter inflation ample time to nibble away at your income.

Anyway -- I followed the CBO link back to see if they disclosed WHO ordered this study and it does not say. But I'm SURE it was ordered by someone favorable to stoking the class war. I DID however find this...

http://cbo.gov/ftpdocs/124xx/doc12485/10-25-HouseholdIncome.pdf

In the main analysis of this study, CBO counted the full
value of health insurance premiums paid by employers as
income.1 However, CBO counted only the so-called fungible
value of Medicare, Medicaid, and CHIP as income.


That measure, developed by the Census Bureau and used
in some of its income definitions, equals the amount of
resources freed up for other uses by that insurance, up to
the average cost of those services (total cost to the government
divided by the number of program participants).
The fungible value of Medicare, Medicaid, and CHIP for
a household thus depends not only on the average cost of
the benefits provided by those programs but also on the income and needs of the household
.2 This appendix also
shows results using the average cost of Medicare, Medicaid,
and CHIP rather than the fungible value.

In other words. It's NOT just income that was counted. Health benefits are ALSO included and in the case of GOVT furnished med benefits, the amount of benefit was discounted by "need"...

Seems like every effort was made to get to a predetermined outcome eh???
 
Top 1% income grew at 275% 1979-2007

Listen WiseAcre -- it's a new age here. You have to start thinking like Russians in the 80's when they watched their news. ESPECIALLY the networks..

WHY on EARTH would CBO release a report NOW about how income levels changed between 1979 and

2007

Is CBO that far behind in their data? No -- CBO works for Congress. So to gin up support for OWS -- some leftist CongressCritter went to CBO and requested that they show the LARGEST gap in incomes possible...

How better to do that then CHERRY-PICKING the data to END just prior to the market and the economy tanking in 2008?? RIGHT SMACK DAB at the top of the BOOMING BUBBLE...

To survive --- we must think PRAVDA comrade. We must have our Double-Speak decoders handy at all times. AND -- we must drink LOTS of Wodka before consuming the State-Sponsored news sources...

:eek:

You don't have to gin up support for the OWS. Most of the people I work with fully support the people that are protesting the increasing inequality in income. And the people that I work with are middle to upper middle blue coller tradesmen.

Then they are protesting the wrong problem.. They will not be part of solution to assuring that America survives in a 21st Century World. Especially if they ignore the massive social values change that we have to place on education and worker skill sets. We cannot prosper by "servicing each to death" while we allow the rest of the world to build all the goods and innovations.. Go ahead and back a mindless mob minus a message.. It means very little actually in the long run.. You have NO PLAN for bringing more money into a Treasury that is a leaking sieve..
 

Forum List

Back
Top