SSDD
Gold Member
- Nov 6, 2012
- 16,672
- 1,966
- 280
A graph prepared by an un named someone on a warmer blog? Are you serious hairball? Let me guess...you are...you will accept anything from anyone so long as it supports your point of view.
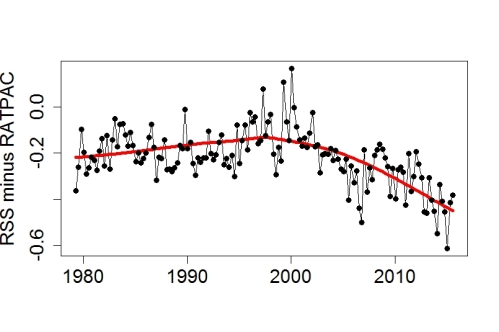
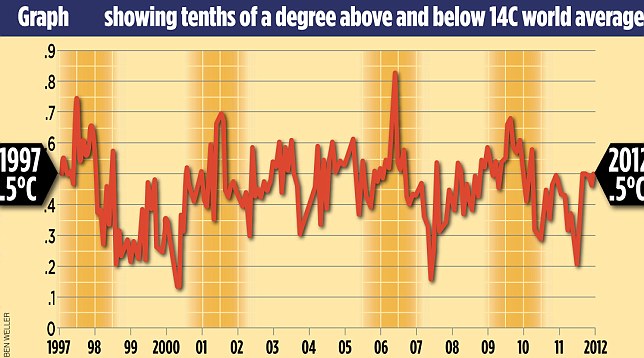
And it doesn't go unnoticed that your....whoever....chose two data sets while the one I provided was the average of 4 data sets and two satellite sets...if your...whoever....had shown a graph using all available data....it would look like the one I posted and not like a cherrypicked graph produced for fear mongers.
And it doesn't go unnoticed that your....whoever....chose two data sets while the one I provided was the average of 4 data sets and two satellite sets...if your...whoever....had shown a graph using all available data....it would look like the one I posted and not like a cherrypicked graph produced for fear mongers.
Last edited:
 on AGW.