Well I finally waded through the cut and paste.science deniers, like you.
Don't forget the climate scientists. They are science deniers too I guess.
Having spoken to you a bit on the topic, I would wager that you have little, to no idea
of what actual climate scientists say on the topic. By your own admission, you have no informed opinion of your own on the topic...you have an opinion that someone else, with a political agenda gave you. Have you ever actually looked at the literature to see what is being said by actual climate scientists?
https://www.sciencedirect.com/science/article/pii/S0964569118303429
“Regionally, the sea levels in the PRD [Pearl River Delta, China] region and Japan show no significant acceleration from 1900 to present, but only oscillations. This result is consistent with the other coastal area of the world where long-term tide gauges are located. Policy making, and management, should therefore focus on adaptive measures linked to the monitoring by tide gauges and Global Navigation Satellite System (GNSS) of relative sea level rise and land subsidence. Extreme sea level rise warnings based on predictions by never validated models, or speculations, that are defocusing coastal management from every other relevant situation, should be discharged.”
“The long-term tide gauges of the world show no significant sign of sea level acceleration since the start of the 20th century.”
“Ocean and coastal management in the area should be based on the accurate monitoring of the relative sea level rise and the subsidence of the land by coupled tide gauge and Global Navigation Satellite System measurements, rather than models’ predictions and speculations defocusing coastal management from more relevant situations than the non-existent threat of extreme sea level rise.”
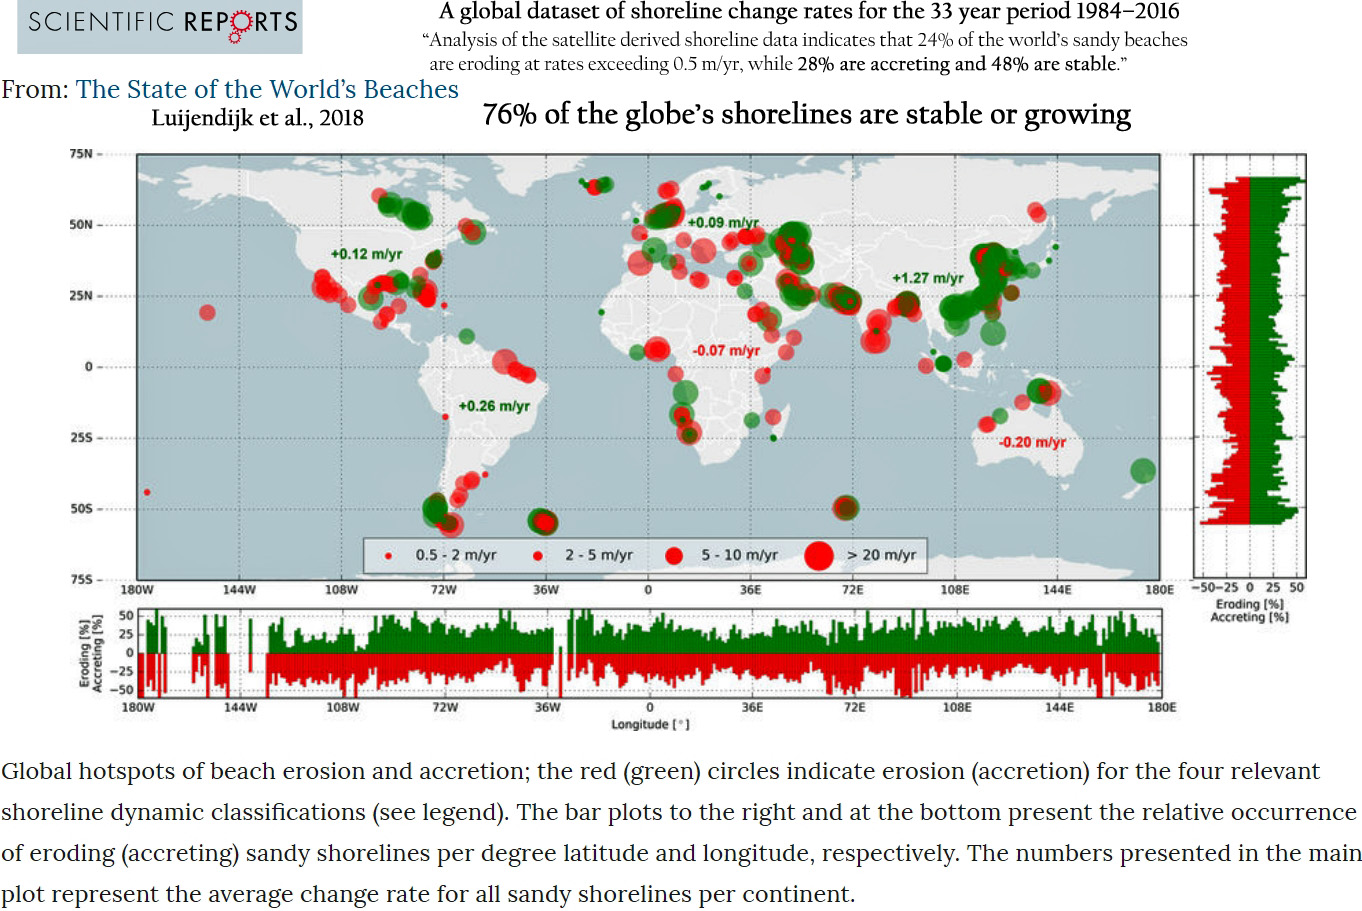
The State of the World’s Beaches
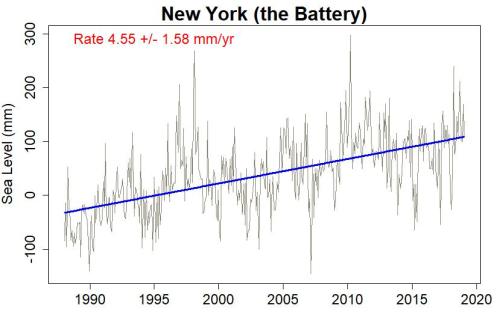
3 mm/yr sea level rise “definitely a conjecture”
https://agupubs.onlinelibrary.wiley.com/doi/full/10.1002/2016GL071355
Decadal variability of European sea level extremes in relation to the solar activity
This study investigates the relationship between decadal changes in solar activity and sea level extremes along the European coasts and derived from tide gauge data. Autumn sea level extremes vary with the 11 year solar cycle at Venice as suggested by previous studies, but a similar link is also found at Trieste. In addition, a solar signal in winter sea level extremes is also found at Venice, Trieste, Marseille, Ceuta, Brest, and Newlyn. The influence of the solar cycle is also evident in the sea level extremes derived from a barotropic model with spatial patterns that are consistent with the correlations obtained at the tide gauges. This agreement indicates that the link to the solar cycle is through modulation of the atmospheric forcing. The only atmospheric regional pattern that showed variability at the 11 year period was the East Atlantic pattern.”
https://agupubs.onlinelibrary.wiley.com/doi/full/10.1002/2014JA020732
The solar and Southern Oscillation components in the satellite altimetry data
With satellite altimetry data accumulating over the past two decades, the mean sea level (MSL) can now be measured to unprecedented accuracy. We search for physical processes which can explain the sea level variations and find that at least 70% of the variance in the annually smoothed detrended altimetry data can be explained as the combined effect of both the solar forcing and the El Niño–Southern Oscillation (ENSO). The phase of the solar component can be used to derive the different steric and eustatic contributions. We find that the peak to peak radiative forcing associated with the solar cycle is 1.33 ± 0.34 W/m2, contributing a 4.4 ± 0.8 mm variation. The slow eustatic component (describing, for example, the cryosphere and large bodies of surface water) has a somewhat smaller peak to peak amplitude of 2.4 ± 0.6 mm. Its phase implies that warming the oceans increases the ocean water loss rate. Additional much smaller terms include a steric feedback term and a fast eustatic term. The ENSO contributes a peak to peak variation of 5.5 ± 0.8 mm, predominantly through a direct effect on the MSL and significantly less so indirectly through variations in the radiative forcing.”
http://coastalratepayersunited.co.nz/docs/science/Tide gauge location-and measurement of SLR.pdf
“Tide gauges dating back to the 19th century were located where sea levels happened to be rising. Data reconstructions based on these tide gauges are therefore likely to over-estimate sea level rise.”
“We therefore study individual tide gauge data on sea levels from the Permanent Service for Mean Sea Level (PSMSL) during 1807 – 2010 without recourse to data reconstruction. Although mean sea levels are rising by 1mm/year, sea level rise is local rather than global, and is concentrated in the Baltic and Adriatic seas, South East Asia and the Atlantic coast of the United States. In these locations, covering 35 percent of tide gauges, sea levels rose on average by 3.8mm/year. Sea levels were stable in locations covered by 61 percent of tide gauges, and sea levels fell in locations covered by 4 percent of tide gauges. In these locations sea levels fell on average by almost 6mm/year.”
And it goes on and on.....the media and a small group of alarmists are hyping a sea level catastrophe....but the actual research tells an entirely different story.
Don't 90% of climate scientist believe in warming?
75% of these that man has something to do with it?