- May 20, 2009
- 145,291
- 68,010
- 2,330
OMMFG!!!!!!!!!
Scripps has published their daily averages too
April 8 - 409.39 ppm
April 9 - 409.44 ppm !!!!!
April 10 - 409.29 ppm
Matty breath into a paper bag, you're hysterical
Follow along with the video below to see how to install our site as a web app on your home screen.

Note: This feature currently requires accessing the site using the built-in Safari browser.
OMMFG!!!!!!!!!
Scripps has published their daily averages too
April 8 - 409.39 ppm
April 9 - 409.44 ppm !!!!!
April 10 - 409.29 ppm
As are all the warmersOMMFG!!!!!!!!!
Scripps has published their daily averages too
April 8 - 409.39 ppm
April 9 - 409.44 ppm !!!!!
April 10 - 409.29 ppm
Matty breath into a paper bag, you're hysterical
what about pray tell? I give two shits if the CO2 goes to five hundred. you can't tell us what the change will do, so why should I give two fks?As are all the warmersOMMFG!!!!!!!!!
Scripps has published their daily averages too
April 8 - 409.39 ppm
April 9 - 409.44 ppm !!!!!
April 10 - 409.29 ppm
Matty breath into a paper bag, you're hysterical
dude, i'm so, so sorry. I misread your post. hahahahahahahahahaaha sometimes I over read a simple line.what about pray tell? I give two shits if the CO2 goes to five hundred. you can't tell us what the change will do, so why should I give two fks?As are all the warmersOMMFG!!!!!!!!!
Scripps has published their daily averages too
April 8 - 409.39 ppm
April 9 - 409.44 ppm !!!!!
April 10 - 409.29 ppm
Matty breath into a paper bag, you're hysterical
easy bro-----it ain't me crying that the sky is falling. Ask Matthew and his buddies what's going to happen next.
Isaac,
Seeing that the Great Dying 250 million years ago(during the Permian) that killed 90%+ of all life on earth was caused by green house gases. This number is in fact a very serious one.
Riiiiiight. So that's why you always have to fudge data and can never present lab work, the changes are too darn quickChange too quick to cope with, you fucking idiot.
Activity Summary: Kīlauea continues to erupt at both the summit, where there is a circulating lava lake, and from its East Rift Zone, where surface lava flows are active northeast of the Puʻu ʻŌʻō vent. The East Rift Zone lava flow currently poses no threat to nearby communities. The summit inflationary trend continued during the past 24 hours; earthquake rates and seismic tremor have not changed significantly in the past day.
")


scribbler on recent CO2 reading and context: Hothouse Gas Spikes to Extreme 409.3 Parts Per Million on April 10 — Record Rate of Atmospheric CO2 Increase Likely for 2016
Hothouse Gas Spikes to Extreme 409.3 Parts Per Million on April 10 — Record Rate of Atmospheric CO2 Increase Likely for 2016
Simply put, a rapid atmospheric accumulation of greenhouse gasses is swiftly pushing the Earth well outside of any climate context that human beings are used to. The influence of an extreme El Nino on the world ocean system’s ability to take down a massive human carbon emission together with signs of what appears to be a significantly smaller but growing emission from global carbon stores looks to be setting the world up for another record jump in atmospheric CO2 levels during 2016.
Already, as we near the annual peak during late April through early May, major CO2 spikes are starting to show up. On Sunday, April 10 the Mauna Loa Observatory recorded a daily CO2 reading in the extraordinary range of 409.3 parts per million. These readings follow March monthly averages near 405 parts per million and precede an annual monthly peak in May that’s likely to hit above 407 parts per million and may strike as high as 409 parts per million. These are levels about 135 to 235 parts per million above the average interglacial to ice age range for CO2 levels during the relatively stable climate period of the last 2 million years.
In other words — atmospheric CO2 levels continue to climb into unprecedented ranges. Levels that are increasingly out-of-context scary. For we haven’t seen readings of this heat trapping gas hit so high in any time during at least the past 15 million years.
God are you stupid.
Mauna Loa Observatory
From Wikipedia, the free encyclopedia
The Observatory from air.
Satellite image of the summit of Mauna Loa overlaid with 100-meter contour lines.
The Mauna Loa Observatory (MLO) is an atmospheric baseline station on Mauna Loa, on the island of Hawaii.
The observatory
Two domes house solar sensors.
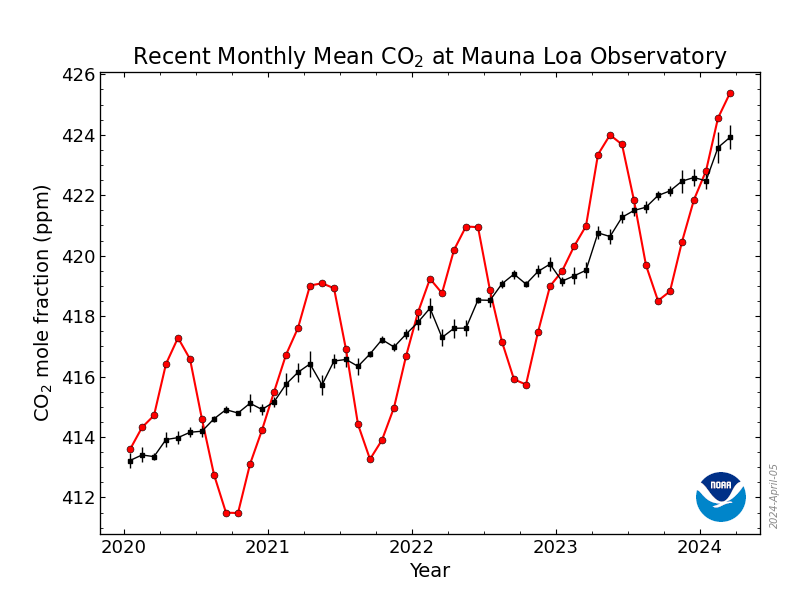
The Keeling Curve: Atmospheric CO2 concentrations as measured at Mauna Loa Observatory
Since 1956 Mauna Loa Observatory (MLO) has been monitoring and collecting data relating to atmospheric change, and is known especially for the continuous monitoring of atmospheric carbon dioxide (CO2), which is sometimes referred to as the Keeling Curve. The observatory is under the Earth System Research Laboratory which is part of the National Oceanic and Atmospheric Administration(NOAA). According to the NOAA, Mauna Loa is the world's oldest continuous CO2 monitoring station, and the world's primary benchmark site for measurement of the gas. [1]
The latest observation of CO2 concentrations from MLO can be found at web sites along with data from other sites[2] and trends at Mauna Loa.[3] The MLO levels can be compared with other sites in the global monitoring network.
MLO has activities at five locations on the Big Island. The primary observing site is located at the 3397 m (11,141 ft) level on Mauna Loa's north slope ( 19°32′10″N 155°34′34″WCoordinates:19°32′10″N 155°34′34″W) about 5 km north of the summit Mokuaweoweo. The Mauna Loa Solar Observatory shares this site. The administration and some data processing are done in the Hilo, Hawaii office. Kulani Mauka is a rain collection site. Cape Kumukahi is a flask sample site located on the easternmost point of Hawaii. At the Hilo airport, weekly balloon-borne instruments are prepared and launched to measure ozone from the surface to usually over 30 km.[4] The observatory site is also a temporary home to acosmic microwave background observatory called AMiBA.[5]
Mauna Loa was originally chosen as a monitoring site because, located far from any continent, the air was sampled and is a good average for the central Pacific. Being high, it is above the inversion layer where most of the local effects are present and there was already a rough road to the summit built by the military. The contamination from local volcanic sources is sometimes detected at the observatory, and is then removed from the background data.[6]
And do you actually think the people at Mauna Loa are unaware of that?
Fucking idiot.
Bill McKibben: Daily co2 measurement at Mauna Loa crosses 407 ppm. Maybe more important than where the Dow stands...
Bill McKibben on Twitter


Wow, 407 ppm!