txlonghorn
Senior Member
- Mar 9, 2009
- 3,042
- 400
- 48
It's business as usual in Obama's second year
Follow along with the video below to see how to install our site as a web app on your home screen.

Note: This feature currently requires accessing the site using the built-in Safari browser.
It's business as usual in Obama's second year
It's business as usual in Obama's second year
they didn't do all that well in Bush's 2nd year, or the 3rd through 8th for that matter
It's business as usual in Obama's second year
they didn't do all that well in Bush's 2nd year, or the 3rd through 8th for that matter
It's business as usual in Obama's second year
they didn't do all that well in Bush's 2nd year, or the 3rd through 8th for that matter
That's just flat out dishonest. The stock market and the economy did excellent through most of Bush's presidency. It was rough at the beginning and the end of his term and there are reasons for that, but no period of growth lasts forever. The economy is cyclical. You have growth periods and have recessive periods.
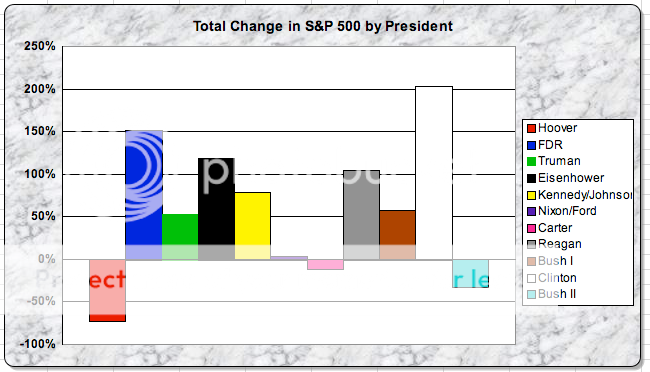
The stock market did horrible under Bush. Since the Depression, only under Hoover did stocks do worse.
http://www.usmessageboard.com/economy/64052-stock-market-performance-by-president.html
Remind us again what is the GOP plan to fix this?
That's just flat out dishonest. The stock market and the economy did excellent through most of Bush's presidency. It was rough at the beginning and the end of his term and there are reasons for that, but no period of growth lasts forever. The economy is cyclical. You have growth periods and have recessive periods.
The stock market did horrible under Bush. Since the Depression, only under Hoover did stocks do worse.
http://www.usmessageboard.com/economy/64052-stock-market-performance-by-president.html
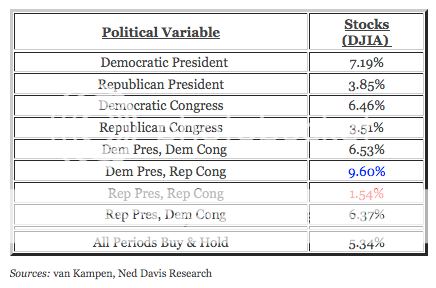
I would love to see that same chart for when congress is controlled by the Democrats and the Republicans through the years........
Remind us again what is the GOP plan to fix this?

What a mess G.W.Bush put us in.
The stock market did horrible under Bush. Since the Depression, only under Hoover did stocks do worse.
http://www.usmessageboard.com/economy/64052-stock-market-performance-by-president.html
I would love to see that same chart for when congress is controlled by the Democrats and the Republicans through the years........
I have that!
This is from 1900 through 2006.
The Big Picture
This is up to the end of 2006, so obviously, Rep Pres,Dem Cong is lower as is Republican President. But also, after 2009, Dem Pres, Dem Cong and Democrat President is now higher.
But for those people who believe that everything revolves around politics, here is economic growth per capita since 1870 to 2006.

Economic Principals Blog Archive The Story So Far
Now, for those highly partisan people, please ascribe the tiny little squiggles in that graph to specific left/right policies.
So it seems like a democrat President with a Republican congress has worked best for the market.
But for now we have record deficits in 09 and a new projected record for 2010. Maybe we'll get that Republican Congress back for 2011.
Really, which planet were you living on?
I would love to see that same chart for when congress is controlled by the Democrats and the Republicans through the years........
Really, which planet were you living on?
the one where my investments were crashing
NASDAQ was 2770 when W took office, having already lost nearly half of its value over the previous 10 months, except for a brief period in 2007, it never got back to that level his entire presidency
S&P was 1342 when he came in, never got above 1560 his entire presidency, and finished in the red for his 8 year term
worst stock market returns for any pres since Hoover
