So the Oceans are rising are they?

Wait a second, 1934 was the warmest year in the lower 48 and you throw that out because "the lower 48 states of the USA only, which is less than 2% of the entire planet"
but a killer Tornado in one city in one of those lower 48 states means AGW is for real?

Seriously?

*** Strawman Alert ***

No, dimwit, nobody says that. Nothing was "thrown out", all the data is till part of the record but it just isn't very significant when talking about global warming.

Also no one claims that one tornado in one city means anything, but a widespread increase over time in the number and severity of extreme weather events worldwide, as we have been seeing and as climate scientists have been predicting would happen, is another pretty good confirmation that the climate is changing.

The US tornado season usually happens in the spring and lasts through July with May and June being the peak months. So we're still in the middle of it with months to go and it is already one of the worst on record. Let's see what happens by the end of summer.

Uh huh

Meanwhile the rest of us are still waiting for those Cat 5 hurricanes and for one single lab experiment that shows how a 60PPM increase in CO2 is responsible for any of it

Like most myopic rightwingnut Americans, you seem to think that the world begins and ends at our borders. A couple of examples that you've never heard of.

Cyclone Nargis was a strong tropical cyclone that caused the worst natural disaster in the recorded history of Myanmar.[1] The cyclone made landfall in the country on May 2, 2008, causing catastrophic destruction and at least 138,000 fatalities.[2][3] The Labutta Township alone was reported to have 80,000 dead, with about 10,000 more deaths in Bogale. There were around 55,000 people missing and many other deaths were found in other towns and areas, although the Burmese government's official death toll may have been underreported, and there have been allegations that they stopped updating the death-toll after 138,000 to minimize political fallout. The feared 'second wave' of fatalities from disease and lack of relief efforts never materialized.[4] Damage was estimated at over US$10 billion, which made it the most damaging cyclone ever recorded in this basin.[5]

Cyclone Sidr was the strongest named cyclone in the Bay of Bengal. The fourth named storm of the 2007 North Indian Ocean cyclone season, Sidr formed in the central Bay of Bengal, and quickly strengthened to reach peak 1-minute sustained winds of 260 km/h (160 mp/h), which would make it a Category-5 equivalent tropical cyclone on the Saffir-Simpson Scale.[2] The storm eventually made landfall in Bangladesh on November 15, 2007. The storm caused large-scale evacuations.[3] 3,447 deaths were blamed on the storm.[4] Save the Children estimated the number of deaths to be between 5,000 and 10,000, while the Red Crescent Society reported on November 18 that the number of deaths could be up to 10,000.[5] International groups pledged US$95 million to repair the damage,[6] which was estimated at $1.7 billion (2007 USD).[6]
 
*** Strawman Alert ***

No, dimwit, nobody says that. Nothing was "thrown out", all the data is till part of the record but it just isn't very significant when talking about global warming.

Also no one claims that one tornado in one city means anything, but a widespread increase over time in the number and severity of extreme weather events worldwide, as we have been seeing and as climate scientists have been predicting would happen, is another pretty good confirmation that the climate is changing.

The US tornado season usually happens in the spring and lasts through July with May and June being the peak months. So we're still in the middle of it with months to go and it is already one of the worst on record. Let's see what happens by the end of summer.

Uh huh

Meanwhile the rest of us are still waiting for those Cat 5 hurricanes and for one single lab experiment that shows how a 60PPM increase in CO2 is responsible for any of it

Like most myopic rightwingnut Americans, you seem to think that the world begins and ends at our borders. A couple of examples that you've never heard of.

Cyclone Nargis was a strong tropical cyclone that caused the worst natural disaster in the recorded history of Myanmar.[1] The cyclone made landfall in the country on May 2, 2008, causing catastrophic destruction and at least 138,000 fatalities.[2][3] The Labutta Township alone was reported to have 80,000 dead, with about 10,000 more deaths in Bogale. There were around 55,000 people missing and many other deaths were found in other towns and areas, although the Burmese government's official death toll may have been underreported, and there have been allegations that they stopped updating the death-toll after 138,000 to minimize political fallout. The feared 'second wave' of fatalities from disease and lack of relief efforts never materialized.[4] Damage was estimated at over US$10 billion, which made it the most damaging cyclone ever recorded in this basin.[5]

Cyclone Sidr was the strongest named cyclone in the Bay of Bengal. The fourth named storm of the 2007 North Indian Ocean cyclone season, Sidr formed in the central Bay of Bengal, and quickly strengthened to reach peak 1-minute sustained winds of 260 km/h (160 mp/h), which would make it a Category-5 equivalent tropical cyclone on the Saffir-Simpson Scale.[2] The storm eventually made landfall in Bangladesh on November 15, 2007. The storm caused large-scale evacuations.[3] 3,447 deaths were blamed on the storm.[4] Save the Children estimated the number of deaths to be between 5,000 and 10,000, while the Red Crescent Society reported on November 18 that the number of deaths could be up to 10,000.[5] International groups pledged US$95 million to repair the damage,[6] which was estimated at $1.7 billion (2007 USD).[6]

And a 60PPM increase in CO2 did that?

Or was it far less than that?

We didn't have that last year and this year we added only 4PPM of CO2, so are you claiming that a 4PPM increase in CO2 causes Killer Cyclones?

Again, the lower 48 states don't count....but a Cyclone in the Bay of Bengal and we all have to shut off Western Civilization for fear of Mo' n Betta' Global Warming

You Warmers are a Cult
 
Uh huh

Meanwhile the rest of us are still waiting for those Cat 5 hurricanes and for one single lab experiment that shows how a 60PPM increase in CO2 is responsible for any of it

Like most myopic rightwingnut Americans, you seem to think that the world begins and ends at our borders. A couple of examples that you've never heard of.

Cyclone Nargis was a strong tropical cyclone that caused the worst natural disaster in the recorded history of Myanmar.[1] The cyclone made landfall in the country on May 2, 2008, causing catastrophic destruction and at least 138,000 fatalities.[2][3] The Labutta Township alone was reported to have 80,000 dead, with about 10,000 more deaths in Bogale. There were around 55,000 people missing and many other deaths were found in other towns and areas, although the Burmese government's official death toll may have been underreported, and there have been allegations that they stopped updating the death-toll after 138,000 to minimize political fallout. The feared 'second wave' of fatalities from disease and lack of relief efforts never materialized.[4] Damage was estimated at over US$10 billion, which made it the most damaging cyclone ever recorded in this basin.[5]

Cyclone Sidr was the strongest named cyclone in the Bay of Bengal. The fourth named storm of the 2007 North Indian Ocean cyclone season, Sidr formed in the central Bay of Bengal, and quickly strengthened to reach peak 1-minute sustained winds of 260 km/h (160 mp/h), which would make it a Category-5 equivalent tropical cyclone on the Saffir-Simpson Scale.[2] The storm eventually made landfall in Bangladesh on November 15, 2007. The storm caused large-scale evacuations.[3] 3,447 deaths were blamed on the storm.[4] Save the Children estimated the number of deaths to be between 5,000 and 10,000, while the Red Crescent Society reported on November 18 that the number of deaths could be up to 10,000.[5] International groups pledged US$95 million to repair the damage,[6] which was estimated at $1.7 billion (2007 USD).[6]

And a 60PPM increase in CO2 did that?
CO2 levels have increased from about 280ppm before 1800 to about 393ppm now. That is an increase of about 113ppm, or about a 40% increase over pre-industrial levels. And yes, that is what is causing the current abrupt warming and climate changes, including stronger storms and more rain.


Again, the lower 48 states don't count....but a Cyclone in the Bay of Bengal and we all have to shut off Western Civilization for fear of Mo' n Betta' Global Warming
You're really confused, crustyfrankfurter, as usual. You were the one who claimed there hadn't been any major storms; I was simply pointing out that there have been some extreme storms around the world in the last decade, not claiming that those storms are any kind of ultimate 'proof' of anything.
[/QUOTE]
 
Wait a second, 1934 was the warmest year in the lower 48 and you throw that out because "the lower 48 states of the USA only, which is less than 2% of the entire planet"
but a killer Tornado in one city in one of those lower 48 states means AGW is for real?

Seriously?

if the USA was warming faster than the rest of the world you certainly wouldnt be hearing the 2% excuse. instead you would be told that the USA has the most weather stations, with the best equipment and data collectors. and it would be true.

but the USA isnt warming as much, the sea levels arent rising as much, etc, etc, and it is more convenient to say it is just a small portion of the world rather than the best measured and analyzed.

Ian, you are turning into a serious wingnut. Look at your avatar. It is generated by the readings of satellites that measure the temperature of the troposphere of the whole world, excepting the polar areas.

Guess what, as anyone can see the direction of the temperature is definatly up.
 
Like most myopic rightwingnut Americans, you seem to think that the world begins and ends at our borders. A couple of examples that you've never heard of.

Cyclone Nargis was a strong tropical cyclone that caused the worst natural disaster in the recorded history of Myanmar.[1] The cyclone made landfall in the country on May 2, 2008, causing catastrophic destruction and at least 138,000 fatalities.[2][3] The Labutta Township alone was reported to have 80,000 dead, with about 10,000 more deaths in Bogale. There were around 55,000 people missing and many other deaths were found in other towns and areas, although the Burmese government's official death toll may have been underreported, and there have been allegations that they stopped updating the death-toll after 138,000 to minimize political fallout. The feared 'second wave' of fatalities from disease and lack of relief efforts never materialized.[4] Damage was estimated at over US$10 billion, which made it the most damaging cyclone ever recorded in this basin.[5]

Cyclone Sidr was the strongest named cyclone in the Bay of Bengal. The fourth named storm of the 2007 North Indian Ocean cyclone season, Sidr formed in the central Bay of Bengal, and quickly strengthened to reach peak 1-minute sustained winds of 260 km/h (160 mp/h), which would make it a Category-5 equivalent tropical cyclone on the Saffir-Simpson Scale.[2] The storm eventually made landfall in Bangladesh on November 15, 2007. The storm caused large-scale evacuations.[3] 3,447 deaths were blamed on the storm.[4] Save the Children estimated the number of deaths to be between 5,000 and 10,000, while the Red Crescent Society reported on November 18 that the number of deaths could be up to 10,000.[5] International groups pledged US$95 million to repair the damage,[6] which was estimated at $1.7 billion (2007 USD).[6]

And a 60PPM increase in CO2 did that?
CO2 levels have increased from about 280ppm before 1800 to about 393ppm now. That is an increase of about 113ppm, or about a 40% increase over pre-industrial levels. And yes, that is what is causing the current abrupt warming and climate changes, including stronger storms and more rain.


Again, the lower 48 states don't count....but a Cyclone in the Bay of Bengal and we all have to shut off Western Civilization for fear of Mo' n Betta' Global Warming
You're really confused, crustyfrankfurter, as usual. You were the one who claimed there hadn't been any major storms; I was simply pointing out that there have been some extreme storms around the world in the last decade, not claiming that those storms are any kind of ultimate 'proof' of anything.
[/QUOTE]

In just the last eleven months, there have been far more than normal extreme weather events worldwide.
 
Rocks, I am not sure I blame many if any of the extreme events on Global Warming.

Just doesnt seem like Hurricanes care that much about a matched two degree increase in the temperature of the air over Cuba and the water around it.

More I watch meterology the more I am interested in urban/suburban heat islands affecting the weather.

Talk receeding ice and I get interested. Remind me my kids have to live on the planet we leave behind and I get interested.

Being a conservative stick in the mud I do believe in greenhouse gasses and pollution controlls.
 
You cannot blame any one event on the warming. It does not work that way. It is like loading dice. Just increases the likelyhood of extreme weather.
 
vers-diff-may-2011-550x371.png

vers-compare-550x429.png

vers-compare-recent-550x429.png

Sea Level Update: More Upward Revision Found


I have to say I was looking forward to the eventual release of the Global Sea level data from the University of Colorado because it was clear from the last update in August that 2010 was going to show a significant drop in sea level from 2009 and I was curious how it would be dealt with. Now it is clear that the latest update included a substantial revision to the data, not just the recent data, but all the data. I guess I should not be surprised by this as it has happened with numerous other data sets. If the data doesn’t support your view, do a revision that fixes the problem.

Nor is this a trivial change. It adds on average 2.6 mm to the global sea level, but not surprisingly it does so more as time goes forward. That average of 2.6 mm is from 1993-2010. The average difference in 2009-2010 is a stunning 4.7mm. After enough tweaking they managed to get 2010 to show a minor increase in sea level from 2009. Here is the version difference between the data that was released last fall and the most recent version.The Inconvenient Skeptic » Sea Level Update: More Upward Revision Found

all of these data sets keep getting revised, and always in the same direction. up.

UC tipped their hand by delaying the updates so many interested spectators made sure the past info was archived, and the same thing is happening to other data sets that seem to change more often than Old Rocks' underwear (just teasing).

why dont the organizations involved ever post up the changes so that people can see the differences? why not list the adjustments, give the reasons, and show the difference pre and post. it would be a lot less suspicious than the large discrepancies we see from one version to another.

bump so that people realize this was a story before it appeared on FoxNews
 
http://theinconvenientskeptic.com/wp-content/uploads/2011/05/vers-diff-may-2011-550x371.png[/IMG]
http://theinconvenientskeptic.com/wp-content/uploads/2011/05/vers-compare-550x429.png[/IMG]
http://theinconvenientskeptic.com/wp-content/uploads/2011/05/vers-compare-recent-550x429.png[/IMG]
Sea Level Update: More Upward Revision Found

I have to say I was looking forward to the eventual release of the Global Sea level data from the University of Colorado because it was clear from the last update in August that 2010 was going to show a significant drop in sea level from 2009 and I was curious how it would be dealt with. Now it is clear that the latest update included a substantial revision to the data, not just the recent data, but all the data. I guess I should not be surprised by this as it has happened with numerous other data sets. If the data doesn’t support your view, do a revision that fixes the problem.

Nor is this a trivial change. It adds on average 2.6 mm to the global sea level, but not surprisingly it does so more as time goes forward. That average of 2.6 mm is from 1993-2010. The average difference in 2009-2010 is a stunning 4.7mm. After enough tweaking they managed to get 2010 to show a minor increase in sea level from 2009. Here is the version difference between the data that was released last fall and the most recent version.The Inconvenient Skeptic » Sea Level Update: More Upward Revision Found

all of these data sets keep getting revised, and always in the same direction. up.

UC tipped their hand by delaying the updates so many interested spectators made sure the past info was archived, and the same thing is happening to other data sets that seem to change more often than Old Rocks' underwear (just teasing).

why dont the organizations involved ever post up the changes so that people can see the differences? why not list the adjustments, give the reasons, and show the difference pre and post. it would be a lot less suspicious than the large discrepancies we see from one version to another.

bump so that people realize this was a story before it appeared on FoxNews

LOLOL...it wasn't a 'story' before or after it appeared on FauxNews and it is even more trivial and meaningless coming from your denier cult blog. Faux's own article highlights just how spun up and distorted the story you're pushing is. Some idiot lawyer from the fossil fuel industry sponsored Heartland Institute that pushes their global warming denial bullshit, comes along and lays out another bullshit scenario that plays on dimwits' paranoia and ignorance of science while the scientists plainly and simply explain the facts of the matter that debunk the lawyer's distortions and lies.

Some excerpts from the FauxNews article:

"Steve Nerem, the director of the widely relied-upon research center, told FoxNews.com that his group added the 0.3 millimeters per year to the actual sea level measurements because land masses, still rebounding from the ice age, are rising and increasing the amount of water that oceans can hold.

"We have to account for the fact that the ocean basins are actually getting slightly bigger... water volume is expanding," he said, a phenomenon they call glacial isostatic adjustment (GIA).

"If we correct our data to remove [the effect of rising land], it actually does cause the rate of sea level (a.k.a. ocean water volume change) rise to be bigger," Nerem wrote. The adjustment is trivial, and not worth public attention, he added.

"For the layperson, this correction is a non-issue and certainly not newsworthy… [The] effect is tiny -- only 1 inch over 100 years, whereas we expect sea level to rise 2-4 feet."

Nerem said that the research center is considering compromising on the adjustment.

"We are considering putting both data sets on our website -- a GIA-corrected dataset, as well as one without the GIA correction," he said.
"


Another sign of how phony this joker and FauxNews' nonsense is, he actually tries to use Al Gore as an argument instead of contesting the actual science. The dumbass lawyer even repeats the moronic denier cult myth about Gore's Montecito home which is actually over a thousand feet about sea level in the hills. It is an 'ocean view' house, not an 'ocean front' house as the denier cult propaganda sources 'reported'. But FauxNews, eternally bereft of fact-checkers, put this buffoons idiotic lie at the very end of their article to give it 'final-word' prominence. Here's this stooges 'logic':

"When Al Gore talks about Manhattan flooding this century, and 20 feet of sea level rise, that’s simply not going to happen. If it were going to happen, he wouldn’t have bought his multi-million dollar mansion along the coast in California."
 
Last edited:
http://theinconvenientskeptic.com/wp-content/uploads/2011/05/vers-diff-may-2011-550x371.png[/IMG]
http://theinconvenientskeptic.com/wp-content/uploads/2011/05/vers-compare-550x429.png[/IMG]
http://theinconvenientskeptic.com/wp-content/uploads/2011/05/vers-compare-recent-550x429.png[/IMG]


all of these data sets keep getting revised, and always in the same direction. up.

UC tipped their hand by delaying the updates so many interested spectators made sure the past info was archived, and the same thing is happening to other data sets that seem to change more often than Old Rocks' underwear (just teasing).

why dont the organizations involved ever post up the changes so that people can see the differences? why not list the adjustments, give the reasons, and show the difference pre and post. it would be a lot less suspicious than the large discrepancies we see from one version to another.

bump so that people realize this was a story before it appeared on FoxNews

LOLOL...it wasn't a 'story' before or after it appeared on FauxNews and it is even more trivial and meaningless coming from your denier cult blog. Faux's own article highlights just how spun up and distorted the story you're pushing is. Some idiot lawyer from the fossil fuel industry sponsored Heartland Institute that pushes their global warming denial bullshit, comes along and lays out another bullshit scenario that plays on dimwits' paranoia and ignorance of science while the scientists plainly and simply explain the facts of the matter that debunk the lawyer's distortions and lies.

Some excerpts from the FauxNews article:

"Steve Nerem, the director of the widely relied-upon research center, told FoxNews.com that his group added the 0.3 millimeters per year to the actual sea level measurements because land masses, still rebounding from the ice age, are rising and increasing the amount of water that oceans can hold.

"We have to account for the fact that the ocean basins are actually getting slightly bigger... water volume is expanding," he said, a phenomenon they call glacial isostatic adjustment (GIA).

"If we correct our data to remove [the effect of rising land], it actually does cause the rate of sea level (a.k.a. ocean water volume change) rise to be bigger," Nerem wrote. The adjustment is trivial, and not worth public attention, he added.

"For the layperson, this correction is a non-issue and certainly not newsworthy… [The] effect is tiny -- only 1 inch over 100 years, whereas we expect sea level to rise 2-4 feet."

Nerem said that the research center is considering compromising on the adjustment.

"We are considering putting both data sets on our website -- a GIA-corrected dataset, as well as one without the GIA correction," he said.
"


Another sign of how phony this joker and FauxNews' nonsense is, he actually tries to use Al Gore as an argument instead of contesting the actual science. The dumbass lawyer even repeats the moronic denier cult myth about Gore's Montecito home which is actually over a thousand feet about sea level in the hills. It is an 'ocean view' house, not an 'ocean front' house as the denier cult propaganda sources 'reported'. But FauxNews, eternally bereft of fact-checkers, put this buffoons idiotic lie at the very end of their article to give it 'final-word' prominence. Here's this stooges 'logic':

"When Al Gore talks about Manhattan flooding this century, and 20 feet of sea level rise, that’s simply not going to happen. If it were going to happen, he wouldn’t have bought his multi-million dollar mansion along the coast in California."

Faking data =/= science, hmmmkay?

"Steve Nerem, the director of the widely relied-upon research center, told FoxNews.com that his group added the 0.3 millimeters per year to the actual sea level measurements..."
 
NASA GISS: Science Briefs: Sea Level Rise, After the Ice Melted and Today

Twentieth century sea level trends, however, are substantially higher that those of the last few thousand years. The current phase of accelerated sea level rise appears to have begun in the mid/late 19th century to early 20th century, based on coastal sediments from a number of localities. Twentieth century global sea level, as determined from tide gauges in coastal harbors, has been increasing by 1.7-1.8 mm/yr, apparently related to the recent climatic warming trend. Most of this rise comes from warming of the world's oceans and melting of mountain glaciers, which have receded dramatically in many places especially during the last few decades. Since 1993, an even higher sea level trend of about 2.8 mm/yr has been measured from the TOPEX/POSEIDON satellite altimeter. Analysis of longer tide-gauge records (1870-2004) also suggests a possible late 20th century acceleration in global sea level.

Recent observations of Greenland and the West Antarctic Ice Sheet raise concerns for the future. Satellites detect a thinning of parts of the Greenland Ice Sheet at lower elevations, and glaciers are disgorging ice into the ocean more rapidly, adding 0.23 to 0.57 mm/yr to the sea within the last decade. The West Antarctic Ice Sheet is also showing some signs of thinning. Either ice sheet, if melted completely, contains enough ice to raise sea level by 5-7 m. A global temperature rise of 2-5°C might destabilize Greenland irreversibly. Such a temperature rise lies within the range of several future climate projections for the 21st century. However, any significant meltdown would take many centuries. Furthermore, even with possible future accelerated discharge from the West Antarctic Ice Sheet, it highly unlikely that annual rates of sea level rise would exceed those of the major post-glacial meltwater pulses.
 
And a 60PPM increase in CO2 did that?
CO2 levels have increased from about 280ppm before 1800 to about 393ppm now. That is an increase of about 113ppm, or about a 40% increase over pre-industrial levels. And yes, that is what is causing the current abrupt warming and climate changes, including stronger storms and more rain.

Again, the lower 48 states don't count....but a Cyclone in the Bay of Bengal and we all have to shut off Western Civilization for fear of Mo' n Betta' Global Warming
You're really confused, crustyfrankfurter, as usual. You were the one who claimed there hadn't been any major storms; I was simply pointing out that there have been some extreme storms around the world in the last decade, not claiming that those storms are any kind of ultimate 'proof' of anything.

In just the last eleven months, there have been far more than normal extreme weather events worldwide.[/QUOTE]

So? Is this predicted by the hypothesis you never post but have tons of fake data to back up?
 
NASA GISS: Science Briefs: Sea Level Rise, After the Ice Melted and Today

Twentieth century sea level trends, however, are substantially higher that those of the last few thousand years. The current phase of accelerated sea level rise appears to have begun in the mid/late 19th century to early 20th century, based on coastal sediments from a number of localities. Twentieth century global sea level, as determined from tide gauges in coastal harbors, has been increasing by 1.7-1.8 mm/yr, apparently related to the recent climatic warming trend. Most of this rise comes from warming of the world's oceans and melting of mountain glaciers, which have receded dramatically in many places especially during the last few decades. Since 1993, an even higher sea level trend of about 2.8 mm/yr has been measured from the TOPEX/POSEIDON satellite altimeter. Analysis of longer tide-gauge records (1870-2004) also suggests a possible late 20th century acceleration in global sea level.

Recent observations of Greenland and the West Antarctic Ice Sheet raise concerns for the future. Satellites detect a thinning of parts of the Greenland Ice Sheet at lower elevations, and glaciers are disgorging ice into the ocean more rapidly, adding 0.23 to 0.57 mm/yr to the sea within the last decade. The West Antarctic Ice Sheet is also showing some signs of thinning. Either ice sheet, if melted completely, contains enough ice to raise sea level by 5-7 m. A global temperature rise of 2-5°C might destabilize Greenland irreversibly. Such a temperature rise lies within the range of several future climate projections for the 21st century. However, any significant meltdown would take many centuries. Furthermore, even with possible future accelerated discharge from the West Antarctic Ice Sheet, it highly unlikely that annual rates of sea level rise would exceed those of the major post-glacial meltwater pulses.

Expressed mathematically we get the following:

ClimateGate + Hide the Decline + Fake Sea Level data = Warmers are Liars
 
http://theinconvenientskeptic.com/wp-content/uploads/2011/05/vers-diff-may-2011-550x371.png[/IMG]
http://theinconvenientskeptic.com/wp-content/uploads/2011/05/vers-compare-550x429.png[/IMG]
http://theinconvenientskeptic.com/wp-content/uploads/2011/05/vers-compare-recent-550x429.png[/IMG]


all of these data sets keep getting revised, and always in the same direction. up.

UC tipped their hand by delaying the updates so many interested spectators made sure the past info was archived, and the same thing is happening to other data sets that seem to change more often than Old Rocks' underwear (just teasing).

why dont the organizations involved ever post up the changes so that people can see the differences? why not list the adjustments, give the reasons, and show the difference pre and post. it would be a lot less suspicious than the large discrepancies we see from one version to another.

bump so that people realize this was a story before it appeared on FoxNews

LOLOL...it wasn't a 'story' before or after it appeared on FauxNews and it is even more trivial and meaningless coming from your denier cult blog. Faux's own article highlights just how spun up and distorted the story you're pushing is. Some idiot lawyer from the fossil fuel industry sponsored Heartland Institute that pushes their global warming denial bullshit, comes along and lays out another bullshit scenario that plays on dimwits' paranoia and ignorance of science while the scientists plainly and simply explain the facts of the matter that debunk the lawyer's distortions and lies.

Some excerpts from the FauxNews article:

"Steve Nerem, the director of the widely relied-upon research center, told FoxNews.com that his group added the 0.3 millimeters per year to the actual sea level measurements because land masses, still rebounding from the ice age, are rising and increasing the amount of water that oceans can hold.

"We have to account for the fact that the ocean basins are actually getting slightly bigger... water volume is expanding," he said, a phenomenon they call glacial isostatic adjustment (GIA).

"If we correct our data to remove [the effect of rising land], it actually does cause the rate of sea level (a.k.a. ocean water volume change) rise to be bigger," Nerem wrote. The adjustment is trivial, and not worth public attention, he added.

"For the layperson, this correction is a non-issue and certainly not newsworthy… [The] effect is tiny -- only 1 inch over 100 years, whereas we expect sea level to rise 2-4 feet."

Nerem said that the research center is considering compromising on the adjustment.

"We are considering putting both data sets on our website -- a GIA-corrected dataset, as well as one without the GIA correction," he said.
"


Another sign of how phony this joker and FauxNews' nonsense is, he actually tries to use Al Gore as an argument instead of contesting the actual science. The dumbass lawyer even repeats the moronic denier cult myth about Gore's Montecito home which is actually over a thousand feet about sea level in the hills. It is an 'ocean view' house, not an 'ocean front' house as the denier cult propaganda sources 'reported'. But FauxNews, eternally bereft of fact-checkers, put this buffoons idiotic lie at the very end of their article to give it 'final-word' prominence. Here's this stooges 'logic':

"When Al Gore talks about Manhattan flooding this century, and 20 feet of sea level rise, that’s simply not going to happen. If it were going to happen, he wouldn’t have bought his multi-million dollar mansion along the coast in California."

not a story? hahaha.

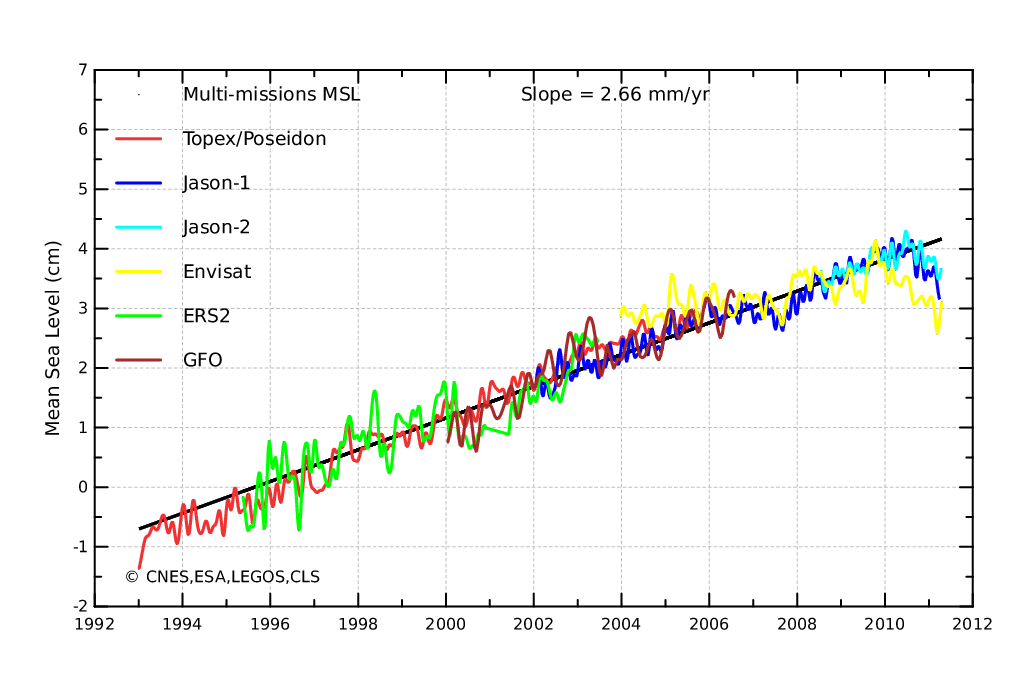
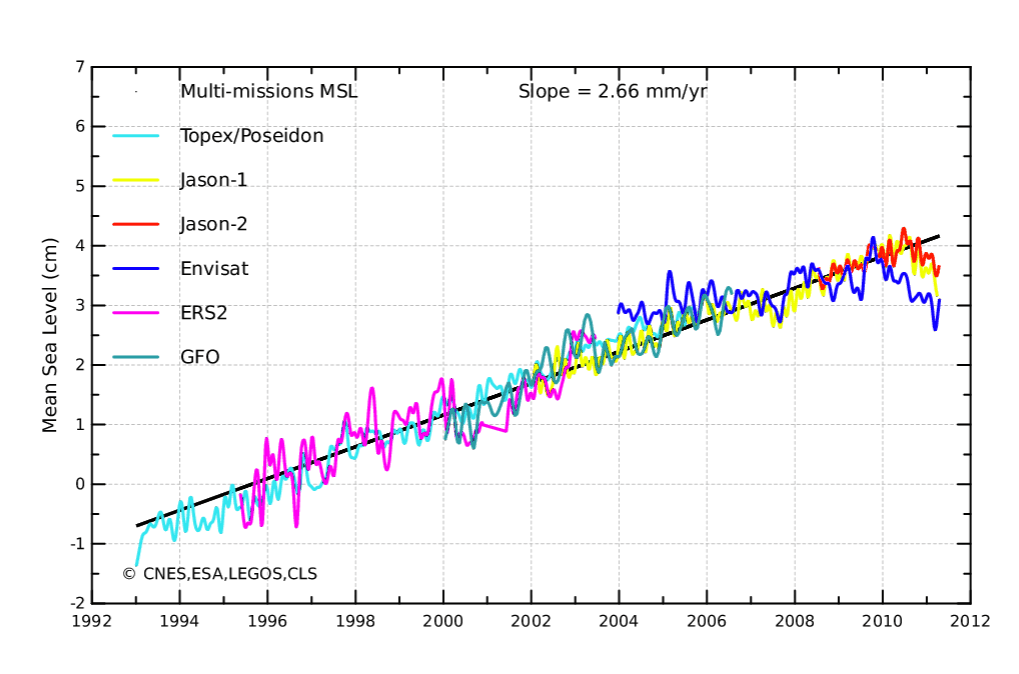
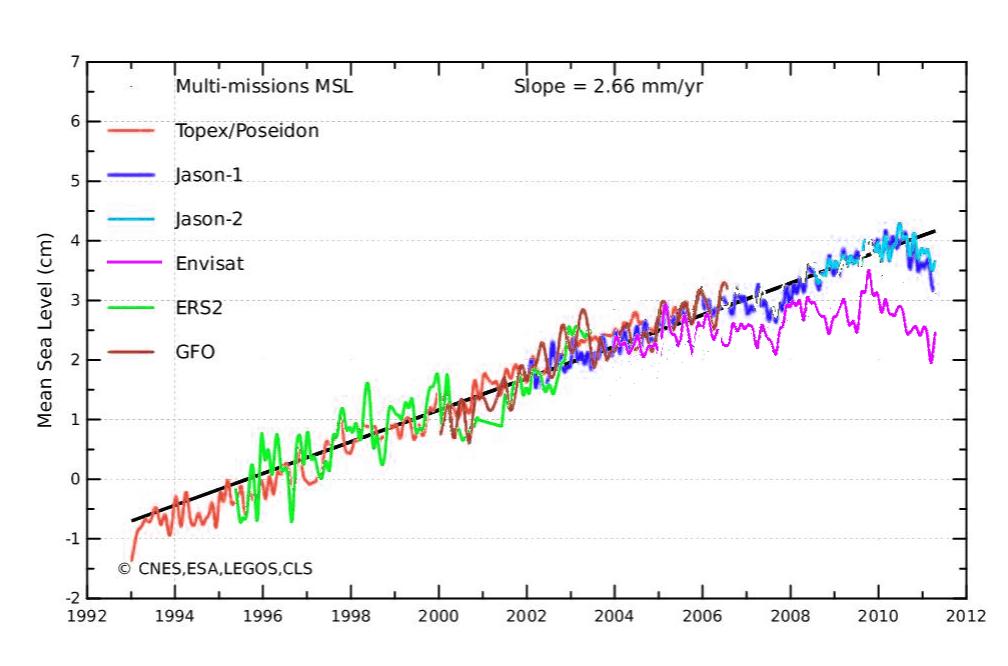
let's look at the timeline. tide gauges show a small and steady increase for 100 yrs, then satellites are put up and find double the rate during a warming trend. global warming is declared settled science in 2001. then the oceans stop warming as much as the models predict, the oceans stop rising as predicted, people start noticing and global warming becomes climate change. the 'play' in the measuring system is used up to support the models. 2010 is found to be tied for the warmest ever but the ocean temps and levels just arent cooperating. data updates are too embarrassing so they stop being released. what can be done?

obviously a new website must be prepared with the necessary corrections and adjustments! and so it came to pass.
 
while I take Stephen Goddard's site with a grain of salt, here is an example of the subtle (or not so subtle) manipulation of the satellite data before the latest round of 'hide the decline.
Hiding The Decline In Sea Level | Real Science

coloured to distract
msl_serie_all_global_ib_rwt_nogia_adjust.png


coloured to make Envisat visible
screenhunter_01-jun-19-08-51.gif


Envisat plotted to line up with other data instead of starting high before dropping
paintimage2111.jpg


I am not saying this is fraud, just suspiciously convenient
 
bump so that people realize this was a story before it appeared on FoxNews

LOLOL...it wasn't a 'story' before or after it appeared on FauxNews and it is even more trivial and meaningless coming from your denier cult blog. Faux's own article highlights just how spun up and distorted the story you're pushing is. Some idiot lawyer from the fossil fuel industry sponsored Heartland Institute that pushes their global warming denial bullshit, comes along and lays out another bullshit scenario that plays on dimwits' paranoia and ignorance of science while the scientists plainly and simply explain the facts of the matter that debunk the lawyer's distortions and lies.

Some excerpts from the FauxNews article:

"Steve Nerem, the director of the widely relied-upon research center, told FoxNews.com that his group added the 0.3 millimeters per year to the actual sea level measurements because land masses, still rebounding from the ice age, are rising and increasing the amount of water that oceans can hold.

"We have to account for the fact that the ocean basins are actually getting slightly bigger... water volume is expanding," he said, a phenomenon they call glacial isostatic adjustment (GIA).

"If we correct our data to remove [the effect of rising land], it actually does cause the rate of sea level (a.k.a. ocean water volume change) rise to be bigger," Nerem wrote. The adjustment is trivial, and not worth public attention, he added.

"For the layperson, this correction is a non-issue and certainly not newsworthy… [The] effect is tiny -- only 1 inch over 100 years, whereas we expect sea level to rise 2-4 feet."

Nerem said that the research center is considering compromising on the adjustment.

"We are considering putting both data sets on our website -- a GIA-corrected dataset, as well as one without the GIA correction," he said.
"


Another sign of how phony this joker and FauxNews' nonsense is, he actually tries to use Al Gore as an argument instead of contesting the actual science. The dumbass lawyer even repeats the moronic denier cult myth about Gore's Montecito home which is actually over a thousand feet about sea level in the hills. It is an 'ocean view' house, not an 'ocean front' house as the denier cult propaganda sources 'reported'. But FauxNews, eternally bereft of fact-checkers, put this buffoons idiotic lie at the very end of their article to give it 'final-word' prominence. Here's this stooges 'logic':

"When Al Gore talks about Manhattan flooding this century, and 20 feet of sea level rise, that’s simply not going to happen. If it were going to happen, he wouldn’t have bought his multi-million dollar mansion along the coast in California."

not a story? hahaha.

let's look at the timeline.
Yeah, your wacked out 'denier cult timeline' that is idiotic and mistaken.


tide gauges show a small and steady increase for 100 yrs, then satellites are put up and find double the rate during a warming trend. global warming is declared settled science in 2001. then the oceans stop warming as much as the models predict, the oceans stop rising as predicted, people start noticing and global warming becomes climate change. the 'play' in the measuring system is used up to support the models. 2010 is found to be tied for the warmest ever but the ocean temps and levels just arent cooperating. data updates are too embarrassing so they stop being released. what can be done?
More of your usual mindless drivel, lies and mistaken nonsense. Please post a citation to 2001 official 'Declaration of Settled Science' announcement you mention. The oceans did not stop warming. Some instrumentation calibration problems gave that impression for a while but further studies corrected the issues and revealed that the oceans have continued to warm. The oceans have continued to rise at the late twentieth century rate of about 3.3mm per year. Both of the terms "global warming" and "climate change" have been is use for decades. The Intergovernmental Panel on Climate Change was established in 1988. Last year was tied with 2005 as the warmest on record and the data on ocean temperatures and sea level rise is in accord and also reflect the warming trend. Data updates are still being released from all of the usual research centers.

As usual, you post some lies from a denier cult blog that have nothing to do with the scientific reality.

Global temperatures were 10th warmest on record for May
NOAA
June 16, 2011

Global surface temperature Anomalies - May 2011.

The globe experienced the 10th warmest May since record keeping began in 1880, as the climate phenomenon La Niña ended its 2011 cycle. The Arctic sea ice extent was the third smallest extent for May on record.

Global temperature highlights: May

* Last month’s combined global land and ocean average surface temperature was the 10th warmest on record for May at 59.50F (15.30 C), which is 0.90 F (0.50 C) above the 20th century average of 58.6 F (14.8 C). The margin of error associated with this temperature is +/- 0.13 F (0.07 C).
* Separately, the global land surface temperature was 1.31 F (0.73 C) above the 20th century average of 52.0 F (11.1 C), which was the seventh warmest May on record. The margin of error is +/- 0.25 F (0.14 C).
* The global ocean surface temperature was 0.74 F (0.41 C) above the 20th century average of 61.3 F (16.3 C), making it the 11th warmest May on record. The margin of error is +/- 0.07 F (0.04 C). The warmth was most pronounced in most of the central and western Pacific, most of the Atlantic, and much of the mid-latitude southern ocean regions.

Global temperature highlights: March – May

* The combined global land and ocean average surface temperature for March – May 2011 was 0.95 F (0.53 C) above the 20th century average of 56.7 F (13.7 C), making it the 10th warmest on record. The margin of error is +/- 0.14 F (0.08 C).
* The worldwide land surface temperature was 1.62 F (0.90 C) above the 20th century average of 46.4 F (8.1 C)—the 10th warmest such period on record. The margin of error is +/- 0.27 F (0.15 C).
* The global ocean surface temperature for March – May was 0.70 F (0.39 C) above the 20th century average of 61.0 F (16.1 C) and was the 11th warmest such period on record. The margin of error is +/-0.70 F (0.39 C). The warmth was most pronounced across the central Pacific Ocean, the eastern and equatorial Atlantic, and the mid-latitude southern oceans.

Global temperature highlights: Year-to-date

* The combined global land and ocean average surface temperature for the year to date (January 2011 – May 2011) was 0.86 F (0.48 C) above the 20th century average of 55.5 F (13.1 C), making it the 12th warmest on record. The margin of error is +/- 0.16 F (0.09 C).
* The year-to-date worldwide land surface temperature was 1.33 F (0.74 C) above the 20th century average — the 15th warmest such period on record. The margin of error is +/- 0.36 F (0.20 C).
* The global ocean surface temperature for the year to date was 0.68 F (0.38 C) above the 20th century average and was the 11th warmest such period on record. The margin of error is +/-0.07 F (0.04 C).
 

Forum List

Back
Top